Immigrants from Yemen vs Guamanian/Chamorro 3rd Grade
COMPARE
Immigrants from Yemen
Guamanian/Chamorro
3rd Grade
3rd Grade Comparison
Immigrants from Yemen
Guamanians/Chamorros
95.6%
3RD GRADE
0.0/ 100
METRIC RATING
345th/ 347
METRIC RANK
97.7%
3RD GRADE
23.6/ 100
METRIC RATING
198th/ 347
METRIC RANK
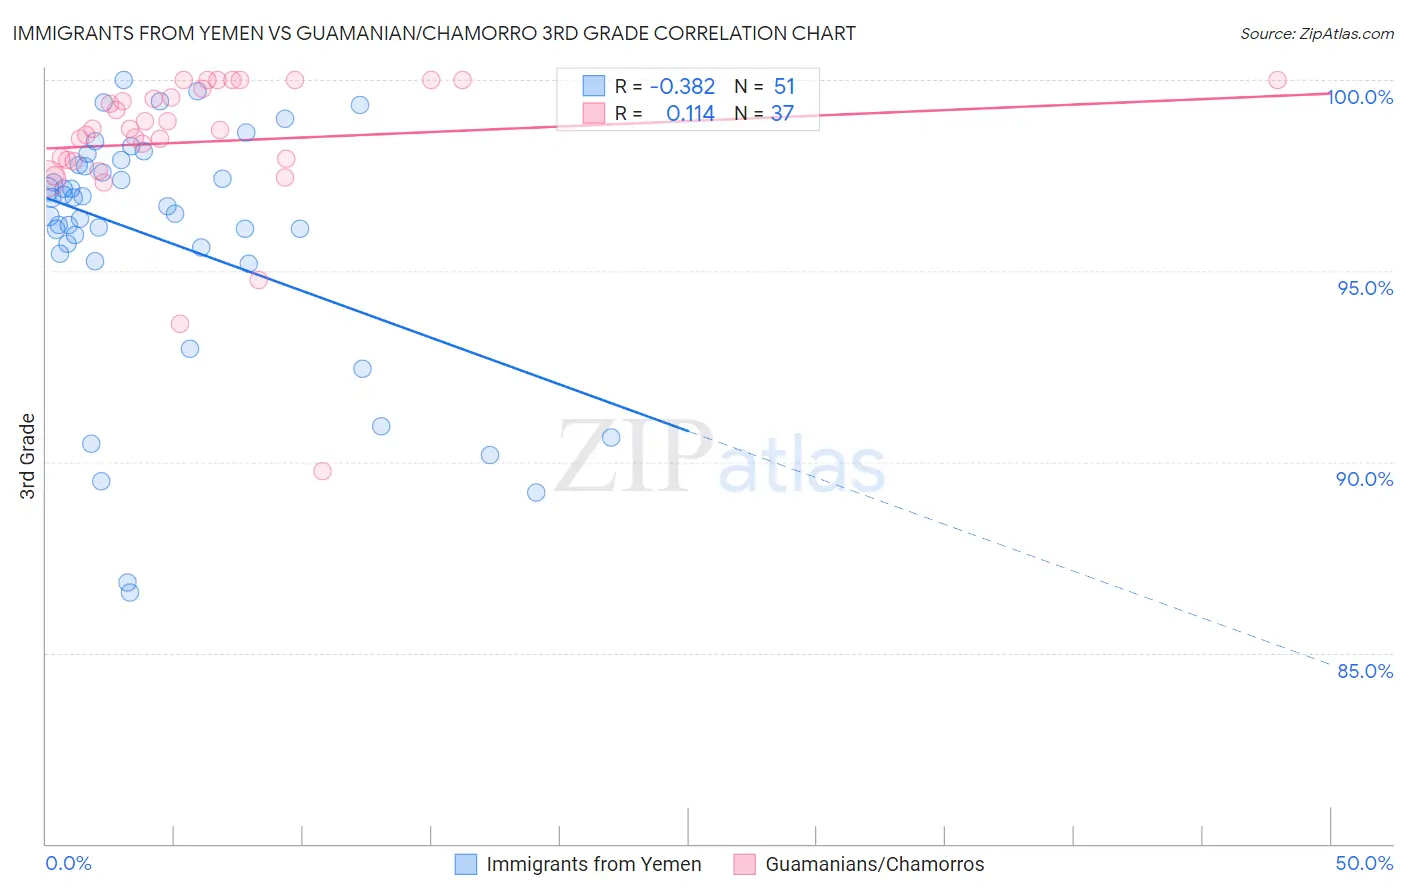
Immigrants from Yemen vs Guamanian/Chamorro 3rd Grade Correlation Chart
The statistical analysis conducted on geographies consisting of 82,433,611 people shows a mild negative correlation between the proportion of Immigrants from Yemen and percentage of population with at least 3rd grade education in the United States with a correlation coefficient (R) of -0.382 and weighted average of 95.6%. Similarly, the statistical analysis conducted on geographies consisting of 221,965,618 people shows a poor positive correlation between the proportion of Guamanians/Chamorros and percentage of population with at least 3rd grade education in the United States with a correlation coefficient (R) of 0.114 and weighted average of 97.7%, a difference of 2.2%.
3rd Grade Correlation Summary
| Measurement | Immigrants from Yemen | Guamanian/Chamorro |
| Minimum | 86.6% | 89.7% |
| Maximum | 100.0% | 100.0% |
| Range | 13.4% | 10.3% |
| Mean | 95.8% | 98.4% |
| Median | 96.7% | 98.7% |
| Interquartile 25% (IQ1) | 95.5% | 97.9% |
| Interquartile 75% (IQ3) | 97.8% | 99.9% |
| Interquartile Range (IQR) | 2.3% | 2.0% |
| Standard Deviation (Sample) | 3.3% | 2.0% |
| Standard Deviation (Population) | 3.2% | 2.0% |
Similar Demographics by 3rd Grade
Demographics Similar to Immigrants from Yemen by 3rd Grade
In terms of 3rd grade, the demographic groups most similar to Immigrants from Yemen are Immigrants from El Salvador (95.5%, a difference of 0.060%), Salvadoran (95.7%, a difference of 0.13%), Immigrants from Mexico (95.8%, a difference of 0.24%), Immigrants from Central America (95.8%, a difference of 0.27%), and Immigrants from Guatemala (95.8%, a difference of 0.27%).
| Demographics | Rating | Rank | 3rd Grade |
| Immigrants | Fiji | 0.0 /100 | #333 | Tragic 96.2% |
| Immigrants | Cambodia | 0.0 /100 | #334 | Tragic 96.2% |
| Immigrants | Dominican Republic | 0.0 /100 | #335 | Tragic 96.2% |
| Immigrants | Cabo Verde | 0.0 /100 | #336 | Tragic 96.2% |
| Central Americans | 0.0 /100 | #337 | Tragic 96.1% |
| Guatemalans | 0.0 /100 | #338 | Tragic 96.0% |
| Yakama | 0.0 /100 | #339 | Tragic 95.9% |
| Nepalese | 0.0 /100 | #340 | Tragic 95.9% |
| Immigrants | Central America | 0.0 /100 | #341 | Tragic 95.8% |
| Immigrants | Guatemala | 0.0 /100 | #342 | Tragic 95.8% |
| Immigrants | Mexico | 0.0 /100 | #343 | Tragic 95.8% |
| Salvadorans | 0.0 /100 | #344 | Tragic 95.7% |
| Immigrants | Yemen | 0.0 /100 | #345 | Tragic 95.6% |
| Immigrants | El Salvador | 0.0 /100 | #346 | Tragic 95.5% |
| Spanish American Indians | 0.0 /100 | #347 | Tragic 95.3% |
Demographics Similar to Guamanians/Chamorros by 3rd Grade
In terms of 3rd grade, the demographic groups most similar to Guamanians/Chamorros are Immigrants from Ukraine (97.7%, a difference of 0.0%), Immigrants from Egypt (97.7%, a difference of 0.010%), Paraguayan (97.7%, a difference of 0.010%), Hawaiian (97.7%, a difference of 0.010%), and Immigrants from Albania (97.7%, a difference of 0.010%).
| Demographics | Rating | Rank | 3rd Grade |
| Blacks/African Americans | 29.6 /100 | #191 | Fair 97.7% |
| Mongolians | 29.1 /100 | #192 | Fair 97.7% |
| Immigrants | Kenya | 28.2 /100 | #193 | Fair 97.7% |
| Immigrants | Uganda | 27.4 /100 | #194 | Fair 97.7% |
| Immigrants | Egypt | 26.8 /100 | #195 | Fair 97.7% |
| Paraguayans | 26.2 /100 | #196 | Fair 97.7% |
| Hawaiians | 25.7 /100 | #197 | Fair 97.7% |
| Guamanians/Chamorros | 23.6 /100 | #198 | Fair 97.7% |
| Immigrants | Ukraine | 22.7 /100 | #199 | Fair 97.7% |
| Immigrants | Albania | 22.6 /100 | #200 | Fair 97.7% |
| Immigrants | Lebanon | 21.7 /100 | #201 | Fair 97.7% |
| Immigrants | Southern Europe | 17.7 /100 | #202 | Poor 97.6% |
| Paiute | 16.7 /100 | #203 | Poor 97.6% |
| Immigrants | Chile | 16.5 /100 | #204 | Poor 97.6% |
| Africans | 14.5 /100 | #205 | Poor 97.6% |