Immigrants from Yemen vs Cuban Ambulatory Disability
COMPARE
Immigrants from Yemen
Cuban
Ambulatory Disability
Ambulatory Disability Comparison
Immigrants from Yemen
Cubans
7.1%
AMBULATORY DISABILITY
0.0/ 100
METRIC RATING
313th/ 347
METRIC RANK
6.4%
AMBULATORY DISABILITY
4.0/ 100
METRIC RATING
227th/ 347
METRIC RANK
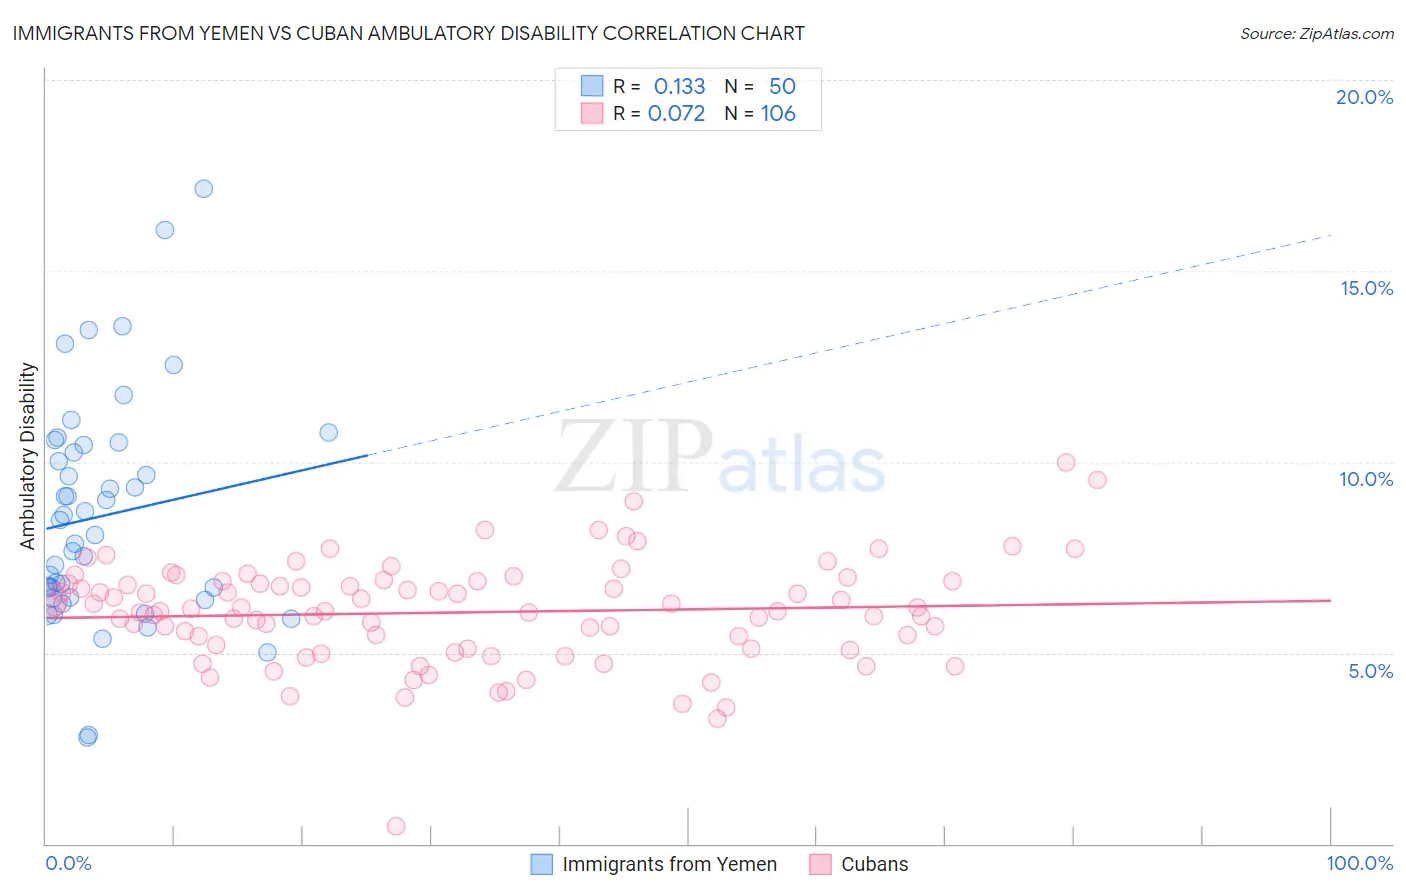
Immigrants from Yemen vs Cuban Ambulatory Disability Correlation Chart
The statistical analysis conducted on geographies consisting of 82,432,015 people shows a poor positive correlation between the proportion of Immigrants from Yemen and percentage of population with ambulatory disability in the United States with a correlation coefficient (R) of 0.133 and weighted average of 7.1%. Similarly, the statistical analysis conducted on geographies consisting of 449,114,501 people shows a slight positive correlation between the proportion of Cubans and percentage of population with ambulatory disability in the United States with a correlation coefficient (R) of 0.072 and weighted average of 6.4%, a difference of 11.8%.
Ambulatory Disability Correlation Summary
| Measurement | Immigrants from Yemen | Cuban |
| Minimum | 2.8% | 0.45% |
| Maximum | 17.1% | 10.0% |
| Range | 14.4% | 9.5% |
| Mean | 8.6% | 6.1% |
| Median | 8.3% | 6.1% |
| Interquartile 25% (IQ1) | 6.4% | 5.1% |
| Interquartile 75% (IQ3) | 10.4% | 6.9% |
| Interquartile Range (IQR) | 4.0% | 1.7% |
| Standard Deviation (Sample) | 3.0% | 1.4% |
| Standard Deviation (Population) | 2.9% | 1.4% |
Similar Demographics by Ambulatory Disability
Demographics Similar to Immigrants from Yemen by Ambulatory Disability
In terms of ambulatory disability, the demographic groups most similar to Immigrants from Yemen are Blackfeet (7.1%, a difference of 0.020%), Shoshone (7.1%, a difference of 0.040%), Delaware (7.1%, a difference of 0.13%), Immigrants from Dominican Republic (7.1%, a difference of 0.28%), and Cree (7.1%, a difference of 0.35%).
| Demographics | Rating | Rank | Ambulatory Disability |
| Iroquois | 0.0 /100 | #306 | Tragic 7.1% |
| Spanish Americans | 0.0 /100 | #307 | Tragic 7.1% |
| Chippewa | 0.0 /100 | #308 | Tragic 7.1% |
| Immigrants | Azores | 0.0 /100 | #309 | Tragic 7.1% |
| Arapaho | 0.0 /100 | #310 | Tragic 7.1% |
| Cree | 0.0 /100 | #311 | Tragic 7.1% |
| Delaware | 0.0 /100 | #312 | Tragic 7.1% |
| Immigrants | Yemen | 0.0 /100 | #313 | Tragic 7.1% |
| Blackfeet | 0.0 /100 | #314 | Tragic 7.1% |
| Shoshone | 0.0 /100 | #315 | Tragic 7.1% |
| Immigrants | Dominican Republic | 0.0 /100 | #316 | Tragic 7.1% |
| Central American Indians | 0.0 /100 | #317 | Tragic 7.2% |
| Ottawa | 0.0 /100 | #318 | Tragic 7.2% |
| Dominicans | 0.0 /100 | #319 | Tragic 7.2% |
| Potawatomi | 0.0 /100 | #320 | Tragic 7.3% |
Demographics Similar to Cubans by Ambulatory Disability
In terms of ambulatory disability, the demographic groups most similar to Cubans are Portuguese (6.4%, a difference of 0.010%), Czechoslovakian (6.4%, a difference of 0.060%), Mexican (6.4%, a difference of 0.17%), Panamanian (6.4%, a difference of 0.32%), and Slavic (6.4%, a difference of 0.33%).
| Demographics | Rating | Rank | Ambulatory Disability |
| Immigrants | Albania | 9.6 /100 | #220 | Tragic 6.3% |
| Hungarians | 9.6 /100 | #221 | Tragic 6.3% |
| German Russians | 9.4 /100 | #222 | Tragic 6.3% |
| Immigrants | Honduras | 7.6 /100 | #223 | Tragic 6.3% |
| Liberians | 7.1 /100 | #224 | Tragic 6.3% |
| Hondurans | 6.3 /100 | #225 | Tragic 6.3% |
| Slavs | 5.1 /100 | #226 | Tragic 6.4% |
| Cubans | 4.0 /100 | #227 | Tragic 6.4% |
| Portuguese | 4.0 /100 | #228 | Tragic 6.4% |
| Czechoslovakians | 3.8 /100 | #229 | Tragic 6.4% |
| Mexicans | 3.5 /100 | #230 | Tragic 6.4% |
| Panamanians | 3.1 /100 | #231 | Tragic 6.4% |
| Assyrians/Chaldeans/Syriacs | 2.4 /100 | #232 | Tragic 6.4% |
| Sub-Saharan Africans | 2.3 /100 | #233 | Tragic 6.4% |
| Immigrants | Liberia | 2.3 /100 | #234 | Tragic 6.4% |