Immigrants from Western Asia vs Spaniard Disability
COMPARE
Immigrants from Western Asia
Spaniard
Disability
Disability Comparison
Immigrants from Western Asia
Spaniards
11.2%
DISABILITY
98.1/ 100
METRIC RATING
91st/ 347
METRIC RANK
12.5%
DISABILITY
0.2/ 100
METRIC RATING
267th/ 347
METRIC RANK
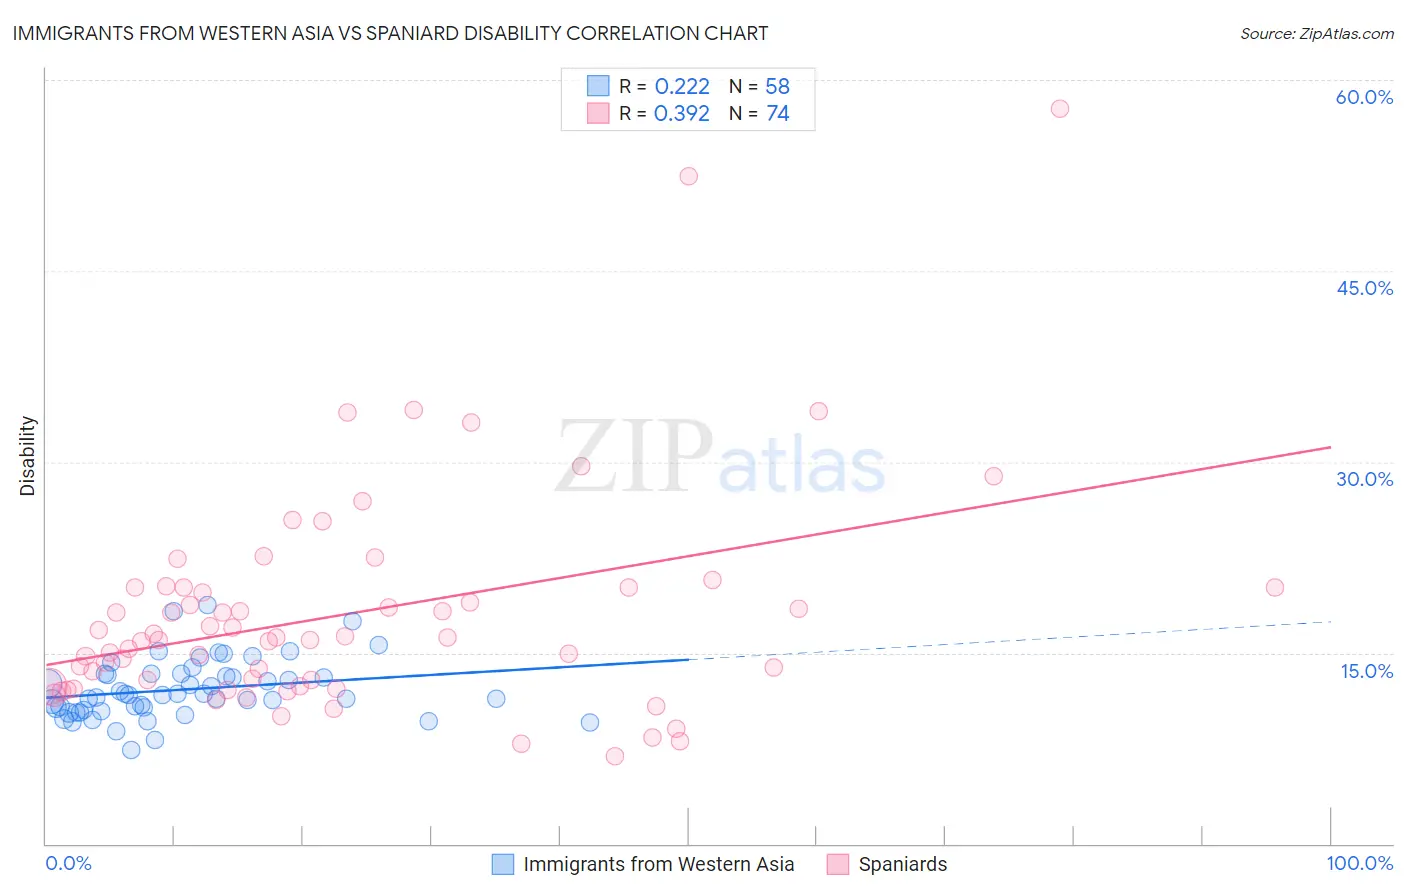
Immigrants from Western Asia vs Spaniard Disability Correlation Chart
The statistical analysis conducted on geographies consisting of 404,425,808 people shows a weak positive correlation between the proportion of Immigrants from Western Asia and percentage of population with a disability in the United States with a correlation coefficient (R) of 0.222 and weighted average of 11.2%. Similarly, the statistical analysis conducted on geographies consisting of 443,457,716 people shows a mild positive correlation between the proportion of Spaniards and percentage of population with a disability in the United States with a correlation coefficient (R) of 0.392 and weighted average of 12.5%, a difference of 11.9%.
Disability Correlation Summary
| Measurement | Immigrants from Western Asia | Spaniard |
| Minimum | 7.4% | 6.9% |
| Maximum | 18.8% | 57.8% |
| Range | 11.4% | 50.9% |
| Mean | 12.1% | 18.1% |
| Median | 11.7% | 16.1% |
| Interquartile 25% (IQ1) | 10.5% | 12.4% |
| Interquartile 75% (IQ3) | 13.4% | 20.1% |
| Interquartile Range (IQR) | 2.8% | 7.7% |
| Standard Deviation (Sample) | 2.3% | 8.8% |
| Standard Deviation (Population) | 2.3% | 8.7% |
Similar Demographics by Disability
Demographics Similar to Immigrants from Western Asia by Disability
In terms of disability, the demographic groups most similar to Immigrants from Western Asia are Immigrants from Brazil (11.2%, a difference of 0.020%), Ecuadorian (11.2%, a difference of 0.040%), Immigrants from Ecuador (11.2%, a difference of 0.040%), Immigrants from South Africa (11.2%, a difference of 0.070%), and Immigrants from Morocco (11.2%, a difference of 0.16%).
| Demographics | Rating | Rank | Disability |
| Immigrants | Sierra Leone | 99.0 /100 | #84 | Exceptional 11.1% |
| Immigrants | Belarus | 98.9 /100 | #85 | Exceptional 11.1% |
| Immigrants | Russia | 98.9 /100 | #86 | Exceptional 11.1% |
| Palestinians | 98.9 /100 | #87 | Exceptional 11.1% |
| Immigrants | Romania | 98.5 /100 | #88 | Exceptional 11.2% |
| Immigrants | South Africa | 98.2 /100 | #89 | Exceptional 11.2% |
| Immigrants | Brazil | 98.1 /100 | #90 | Exceptional 11.2% |
| Immigrants | Western Asia | 98.1 /100 | #91 | Exceptional 11.2% |
| Ecuadorians | 98.0 /100 | #92 | Exceptional 11.2% |
| Immigrants | Ecuador | 98.0 /100 | #93 | Exceptional 11.2% |
| Immigrants | Morocco | 97.8 /100 | #94 | Exceptional 11.2% |
| Eastern Europeans | 97.8 /100 | #95 | Exceptional 11.2% |
| Immigrants | Zimbabwe | 97.7 /100 | #96 | Exceptional 11.2% |
| Bhutanese | 97.4 /100 | #97 | Exceptional 11.2% |
| Uruguayans | 97.4 /100 | #98 | Exceptional 11.2% |
Demographics Similar to Spaniards by Disability
In terms of disability, the demographic groups most similar to Spaniards are Czechoslovakian (12.5%, a difference of 0.070%), U.S. Virgin Islander (12.5%, a difference of 0.24%), Immigrants from Germany (12.5%, a difference of 0.26%), Bangladeshi (12.6%, a difference of 0.33%), and Hawaiian (12.5%, a difference of 0.37%).
| Demographics | Rating | Rank | Disability |
| Immigrants | Liberia | 0.4 /100 | #260 | Tragic 12.4% |
| Scandinavians | 0.4 /100 | #261 | Tragic 12.4% |
| Native Hawaiians | 0.3 /100 | #262 | Tragic 12.5% |
| Hawaiians | 0.2 /100 | #263 | Tragic 12.5% |
| Immigrants | Germany | 0.2 /100 | #264 | Tragic 12.5% |
| U.S. Virgin Islanders | 0.2 /100 | #265 | Tragic 12.5% |
| Czechoslovakians | 0.2 /100 | #266 | Tragic 12.5% |
| Spaniards | 0.2 /100 | #267 | Tragic 12.5% |
| Bangladeshis | 0.1 /100 | #268 | Tragic 12.6% |
| Immigrants | Dominican Republic | 0.1 /100 | #269 | Tragic 12.6% |
| Portuguese | 0.1 /100 | #270 | Tragic 12.6% |
| Immigrants | Yemen | 0.1 /100 | #271 | Tragic 12.6% |
| Dominicans | 0.0 /100 | #272 | Tragic 12.7% |
| Finns | 0.0 /100 | #273 | Tragic 12.7% |
| Nepalese | 0.0 /100 | #274 | Tragic 12.8% |