Immigrants from Western Asia vs Spaniard Single Mother Households
COMPARE
Immigrants from Western Asia
Spaniard
Single Mother Households
Single Mother Households Comparison
Immigrants from Western Asia
Spaniards
5.7%
SINGLE MOTHER HOUSEHOLDS
96.7/ 100
METRIC RATING
92nd/ 347
METRIC RANK
6.5%
SINGLE MOTHER HOUSEHOLDS
27.8/ 100
METRIC RATING
183rd/ 347
METRIC RANK
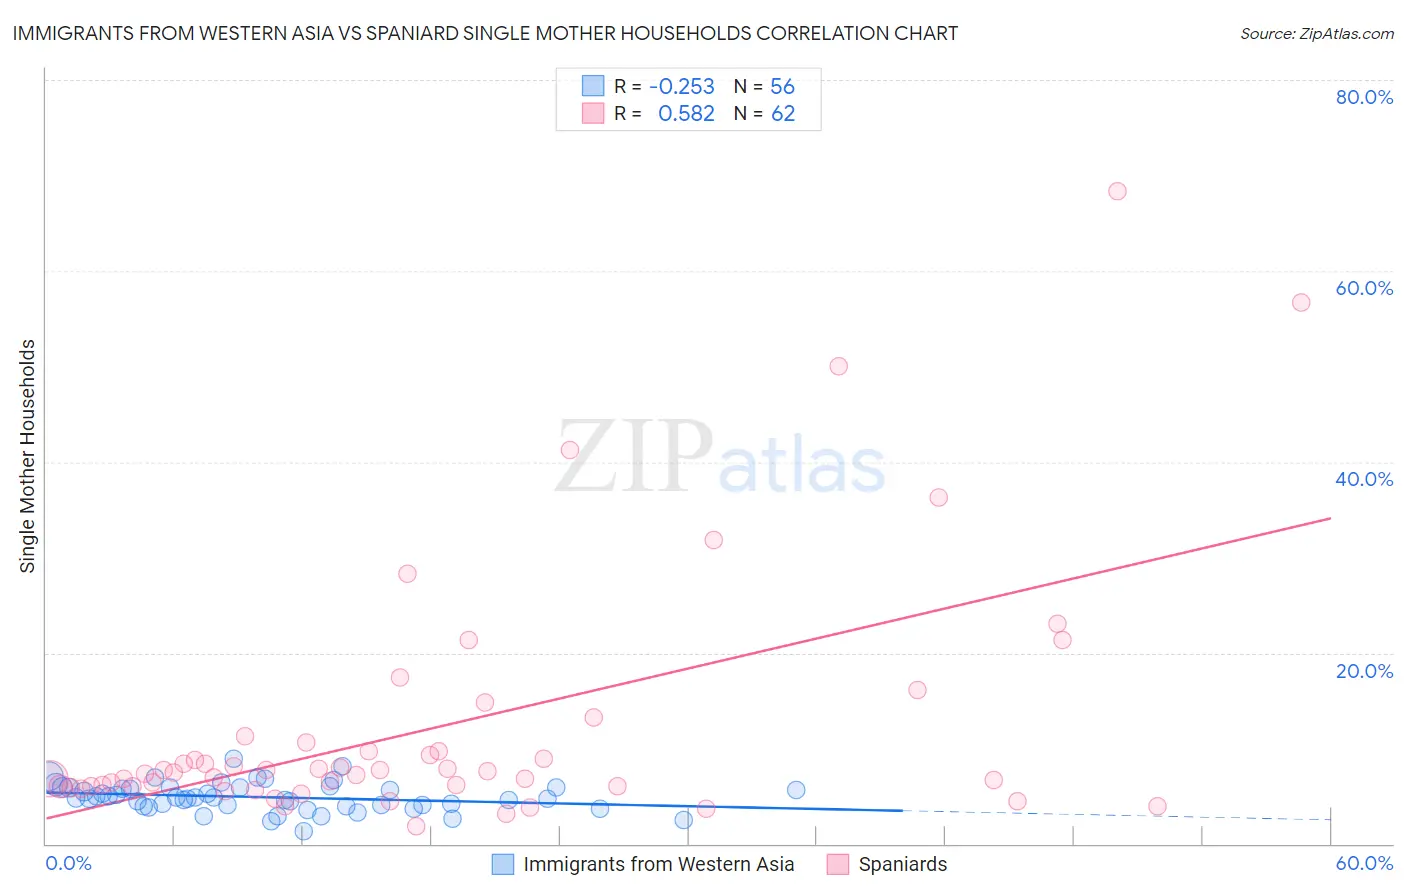
Immigrants from Western Asia vs Spaniard Single Mother Households Correlation Chart
The statistical analysis conducted on geographies consisting of 403,187,700 people shows a weak negative correlation between the proportion of Immigrants from Western Asia and percentage of single mother households in the United States with a correlation coefficient (R) of -0.253 and weighted average of 5.7%. Similarly, the statistical analysis conducted on geographies consisting of 441,881,486 people shows a substantial positive correlation between the proportion of Spaniards and percentage of single mother households in the United States with a correlation coefficient (R) of 0.582 and weighted average of 6.5%, a difference of 13.1%.
Single Mother Households Correlation Summary
| Measurement | Immigrants from Western Asia | Spaniard |
| Minimum | 1.3% | 1.9% |
| Maximum | 8.8% | 68.3% |
| Range | 7.6% | 66.4% |
| Mean | 4.9% | 12.3% |
| Median | 4.8% | 7.5% |
| Interquartile 25% (IQ1) | 4.0% | 6.0% |
| Interquartile 75% (IQ3) | 5.9% | 10.6% |
| Interquartile Range (IQR) | 1.9% | 4.7% |
| Standard Deviation (Sample) | 1.5% | 13.2% |
| Standard Deviation (Population) | 1.4% | 13.1% |
Similar Demographics by Single Mother Households
Demographics Similar to Immigrants from Western Asia by Single Mother Households
In terms of single mother households, the demographic groups most similar to Immigrants from Western Asia are Serbian (5.7%, a difference of 0.010%), Basque (5.7%, a difference of 0.060%), Slovak (5.7%, a difference of 0.12%), European (5.7%, a difference of 0.23%), and Austrian (5.7%, a difference of 0.27%).
| Demographics | Rating | Rank | Single Mother Households |
| Hungarians | 97.6 /100 | #85 | Exceptional 5.7% |
| Finns | 97.6 /100 | #86 | Exceptional 5.7% |
| Immigrants | Turkey | 97.5 /100 | #87 | Exceptional 5.7% |
| Israelis | 97.4 /100 | #88 | Exceptional 5.7% |
| Ukrainians | 97.2 /100 | #89 | Exceptional 5.7% |
| Immigrants | Indonesia | 97.2 /100 | #90 | Exceptional 5.7% |
| Europeans | 97.0 /100 | #91 | Exceptional 5.7% |
| Immigrants | Western Asia | 96.7 /100 | #92 | Exceptional 5.7% |
| Serbians | 96.7 /100 | #93 | Exceptional 5.7% |
| Basques | 96.7 /100 | #94 | Exceptional 5.7% |
| Slovaks | 96.6 /100 | #95 | Exceptional 5.7% |
| Austrians | 96.4 /100 | #96 | Exceptional 5.7% |
| Tlingit-Haida | 96.4 /100 | #97 | Exceptional 5.7% |
| Immigrants | South Africa | 96.3 /100 | #98 | Exceptional 5.7% |
| Immigrants | Poland | 96.3 /100 | #99 | Exceptional 5.8% |
Demographics Similar to Spaniards by Single Mother Households
In terms of single mother households, the demographic groups most similar to Spaniards are Ethiopian (6.5%, a difference of 0.24%), Ugandan (6.5%, a difference of 0.30%), Costa Rican (6.5%, a difference of 0.42%), Immigrants from Afghanistan (6.5%, a difference of 0.43%), and Ottawa (6.5%, a difference of 0.56%).
| Demographics | Rating | Rank | Single Mother Households |
| Immigrants | Bosnia and Herzegovina | 44.3 /100 | #176 | Average 6.3% |
| Osage | 43.0 /100 | #177 | Average 6.4% |
| Portuguese | 40.0 /100 | #178 | Fair 6.4% |
| Hmong | 39.8 /100 | #179 | Fair 6.4% |
| Immigrants | Nepal | 36.1 /100 | #180 | Fair 6.4% |
| Spanish | 33.4 /100 | #181 | Fair 6.4% |
| South American Indians | 33.4 /100 | #182 | Fair 6.4% |
| Spaniards | 27.8 /100 | #183 | Fair 6.5% |
| Ethiopians | 26.0 /100 | #184 | Fair 6.5% |
| Ugandans | 25.6 /100 | #185 | Fair 6.5% |
| Costa Ricans | 24.8 /100 | #186 | Fair 6.5% |
| Immigrants | Afghanistan | 24.7 /100 | #187 | Fair 6.5% |
| Ottawa | 23.8 /100 | #188 | Fair 6.5% |
| Delaware | 23.3 /100 | #189 | Fair 6.5% |
| Peruvians | 21.6 /100 | #190 | Fair 6.5% |