Immigrants from Western Asia vs Cherokee Disability
COMPARE
Immigrants from Western Asia
Cherokee
Disability
Disability Comparison
Immigrants from Western Asia
Cherokee
11.2%
DISABILITY
98.1/ 100
METRIC RATING
91st/ 347
METRIC RANK
14.8%
DISABILITY
0.0/ 100
METRIC RATING
336th/ 347
METRIC RANK
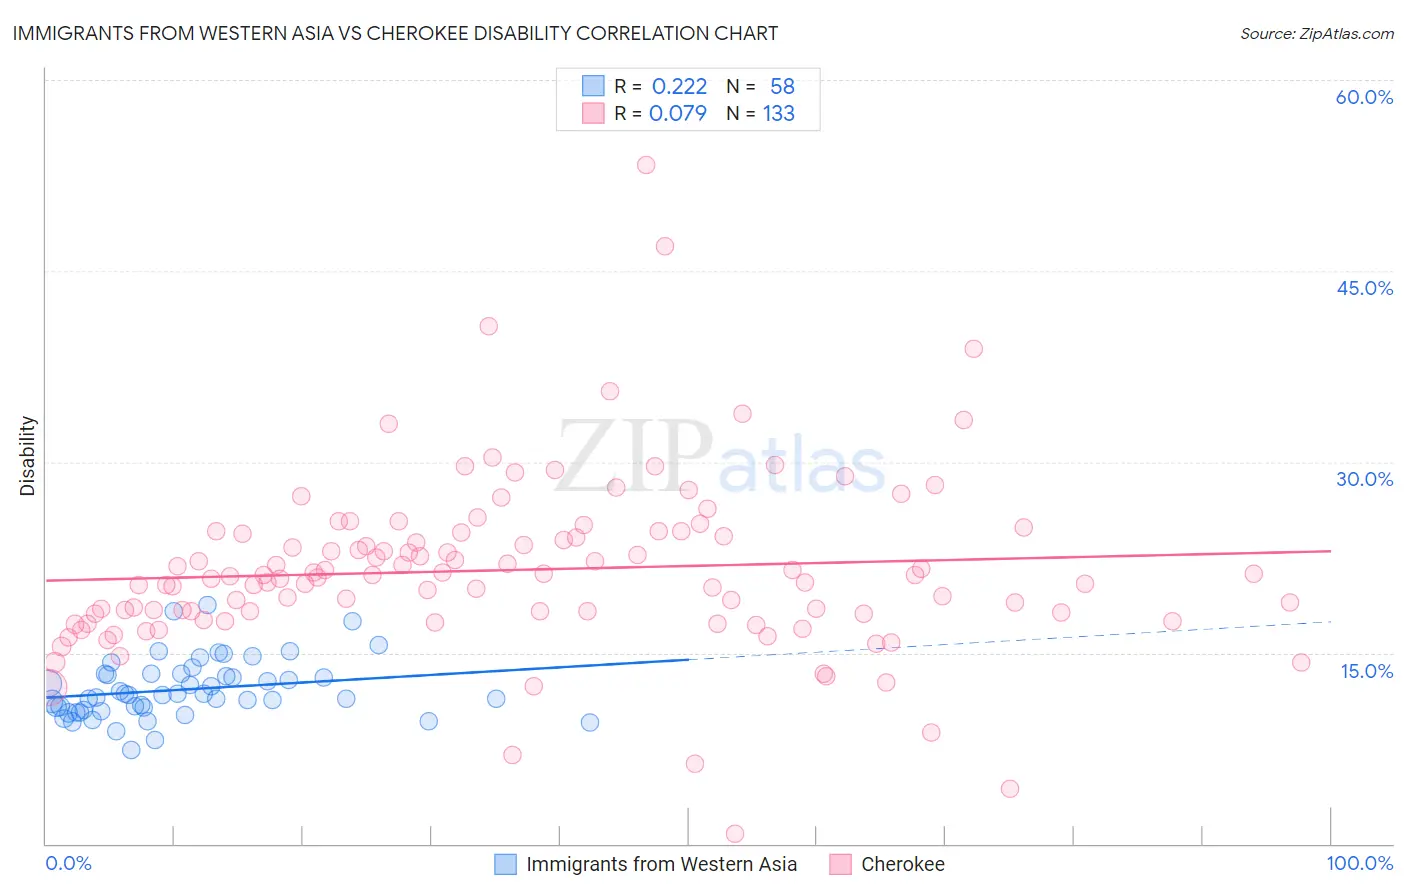
Immigrants from Western Asia vs Cherokee Disability Correlation Chart
The statistical analysis conducted on geographies consisting of 404,425,808 people shows a weak positive correlation between the proportion of Immigrants from Western Asia and percentage of population with a disability in the United States with a correlation coefficient (R) of 0.222 and weighted average of 11.2%. Similarly, the statistical analysis conducted on geographies consisting of 493,590,600 people shows a slight positive correlation between the proportion of Cherokee and percentage of population with a disability in the United States with a correlation coefficient (R) of 0.079 and weighted average of 14.8%, a difference of 32.7%.
Disability Correlation Summary
| Measurement | Immigrants from Western Asia | Cherokee |
| Minimum | 7.4% | 0.80% |
| Maximum | 18.8% | 53.3% |
| Range | 11.4% | 52.5% |
| Mean | 12.1% | 21.5% |
| Median | 11.7% | 21.0% |
| Interquartile 25% (IQ1) | 10.5% | 18.0% |
| Interquartile 75% (IQ3) | 13.4% | 24.4% |
| Interquartile Range (IQR) | 2.8% | 6.4% |
| Standard Deviation (Sample) | 2.3% | 6.9% |
| Standard Deviation (Population) | 2.3% | 6.9% |
Similar Demographics by Disability
Demographics Similar to Immigrants from Western Asia by Disability
In terms of disability, the demographic groups most similar to Immigrants from Western Asia are Immigrants from Brazil (11.2%, a difference of 0.020%), Ecuadorian (11.2%, a difference of 0.040%), Immigrants from Ecuador (11.2%, a difference of 0.040%), Immigrants from South Africa (11.2%, a difference of 0.070%), and Immigrants from Morocco (11.2%, a difference of 0.16%).
| Demographics | Rating | Rank | Disability |
| Immigrants | Sierra Leone | 99.0 /100 | #84 | Exceptional 11.1% |
| Immigrants | Belarus | 98.9 /100 | #85 | Exceptional 11.1% |
| Immigrants | Russia | 98.9 /100 | #86 | Exceptional 11.1% |
| Palestinians | 98.9 /100 | #87 | Exceptional 11.1% |
| Immigrants | Romania | 98.5 /100 | #88 | Exceptional 11.2% |
| Immigrants | South Africa | 98.2 /100 | #89 | Exceptional 11.2% |
| Immigrants | Brazil | 98.1 /100 | #90 | Exceptional 11.2% |
| Immigrants | Western Asia | 98.1 /100 | #91 | Exceptional 11.2% |
| Ecuadorians | 98.0 /100 | #92 | Exceptional 11.2% |
| Immigrants | Ecuador | 98.0 /100 | #93 | Exceptional 11.2% |
| Immigrants | Morocco | 97.8 /100 | #94 | Exceptional 11.2% |
| Eastern Europeans | 97.8 /100 | #95 | Exceptional 11.2% |
| Immigrants | Zimbabwe | 97.7 /100 | #96 | Exceptional 11.2% |
| Bhutanese | 97.4 /100 | #97 | Exceptional 11.2% |
| Uruguayans | 97.4 /100 | #98 | Exceptional 11.2% |
Demographics Similar to Cherokee by Disability
In terms of disability, the demographic groups most similar to Cherokee are Seminole (14.9%, a difference of 0.090%), Dutch West Indian (14.9%, a difference of 0.39%), Tohono O'odham (14.8%, a difference of 0.51%), Yuman (14.6%, a difference of 1.5%), and Cajun (14.6%, a difference of 1.7%).
| Demographics | Rating | Rank | Disability |
| Potawatomi | 0.0 /100 | #329 | Tragic 14.2% |
| Navajo | 0.0 /100 | #330 | Tragic 14.3% |
| Alaskan Athabascans | 0.0 /100 | #331 | Tragic 14.4% |
| Pueblo | 0.0 /100 | #332 | Tragic 14.4% |
| Cajuns | 0.0 /100 | #333 | Tragic 14.6% |
| Yuman | 0.0 /100 | #334 | Tragic 14.6% |
| Tohono O'odham | 0.0 /100 | #335 | Tragic 14.8% |
| Cherokee | 0.0 /100 | #336 | Tragic 14.8% |
| Seminole | 0.0 /100 | #337 | Tragic 14.9% |
| Dutch West Indians | 0.0 /100 | #338 | Tragic 14.9% |
| Chickasaw | 0.0 /100 | #339 | Tragic 15.2% |
| Choctaw | 0.0 /100 | #340 | Tragic 15.4% |
| Lumbee | 0.0 /100 | #341 | Tragic 15.5% |
| Kiowa | 0.0 /100 | #342 | Tragic 15.6% |
| Creek | 0.0 /100 | #343 | Tragic 15.6% |