Central American vs Spaniard Disability
COMPARE
Central American
Spaniard
Disability
Disability Comparison
Central Americans
Spaniards
11.4%
DISABILITY
93.5/ 100
METRIC RATING
119th/ 347
METRIC RANK
12.5%
DISABILITY
0.2/ 100
METRIC RATING
267th/ 347
METRIC RANK
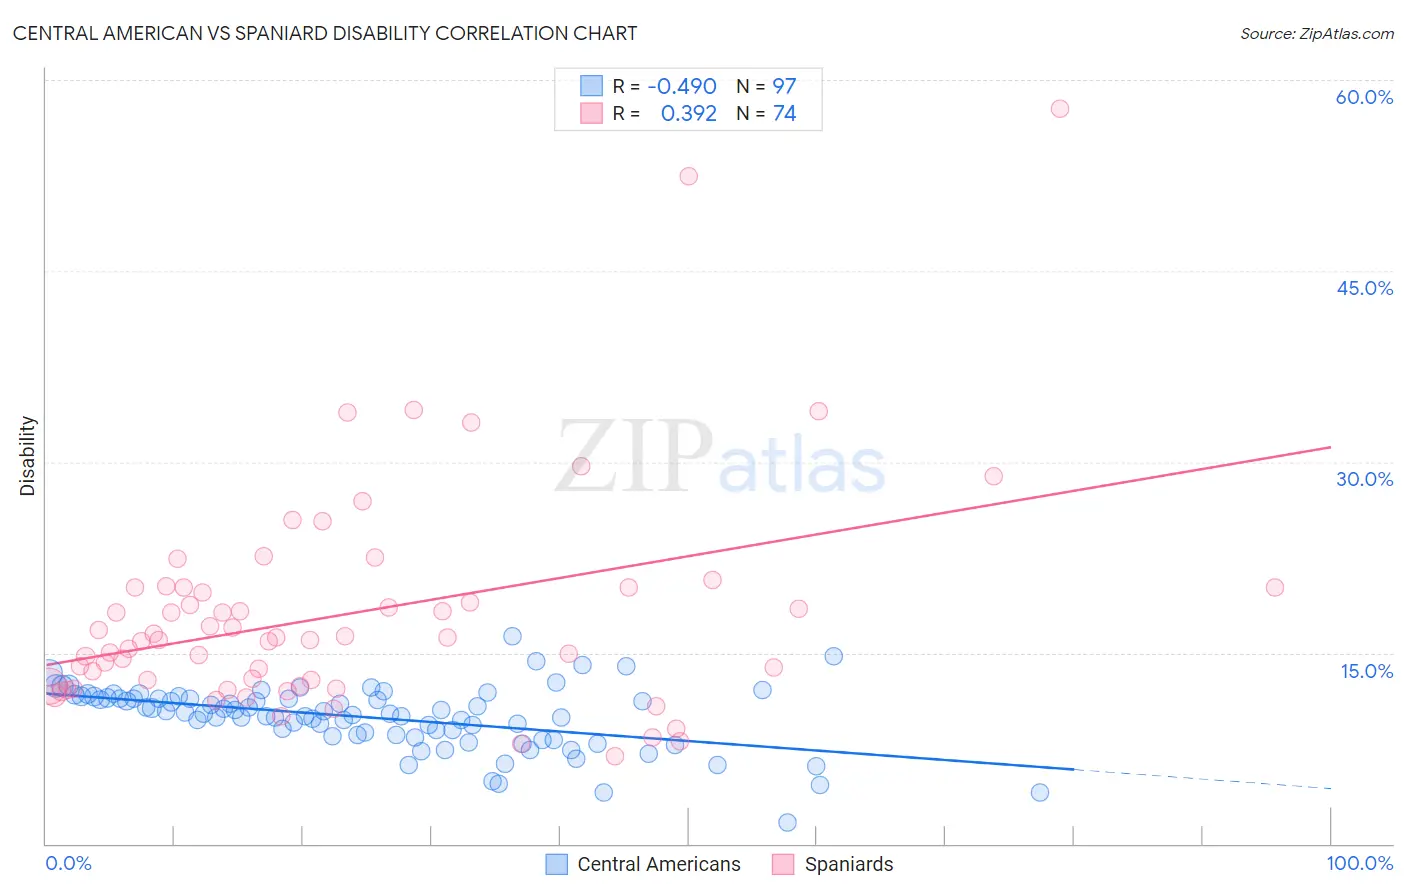
Central American vs Spaniard Disability Correlation Chart
The statistical analysis conducted on geographies consisting of 504,498,688 people shows a moderate negative correlation between the proportion of Central Americans and percentage of population with a disability in the United States with a correlation coefficient (R) of -0.490 and weighted average of 11.4%. Similarly, the statistical analysis conducted on geographies consisting of 443,457,716 people shows a mild positive correlation between the proportion of Spaniards and percentage of population with a disability in the United States with a correlation coefficient (R) of 0.392 and weighted average of 12.5%, a difference of 10.3%.
Disability Correlation Summary
| Measurement | Central American | Spaniard |
| Minimum | 1.6% | 6.9% |
| Maximum | 16.3% | 57.8% |
| Range | 14.6% | 50.9% |
| Mean | 9.9% | 18.1% |
| Median | 10.3% | 16.1% |
| Interquartile 25% (IQ1) | 8.5% | 12.4% |
| Interquartile 75% (IQ3) | 11.4% | 20.1% |
| Interquartile Range (IQR) | 3.0% | 7.7% |
| Standard Deviation (Sample) | 2.5% | 8.8% |
| Standard Deviation (Population) | 2.5% | 8.7% |
Similar Demographics by Disability
Demographics Similar to Central Americans by Disability
In terms of disability, the demographic groups most similar to Central Americans are Immigrants from North Macedonia (11.4%, a difference of 0.0%), Immigrants from Costa Rica (11.4%, a difference of 0.010%), Brazilian (11.4%, a difference of 0.040%), Korean (11.3%, a difference of 0.050%), and Luxembourger (11.3%, a difference of 0.070%).
| Demographics | Rating | Rank | Disability |
| Immigrants | Uzbekistan | 94.9 /100 | #112 | Exceptional 11.3% |
| Guyanese | 94.7 /100 | #113 | Exceptional 11.3% |
| Immigrants | Syria | 94.7 /100 | #114 | Exceptional 11.3% |
| Immigrants | Philippines | 94.6 /100 | #115 | Exceptional 11.3% |
| Immigrants | Northern Europe | 94.1 /100 | #116 | Exceptional 11.3% |
| Luxembourgers | 93.9 /100 | #117 | Exceptional 11.3% |
| Koreans | 93.8 /100 | #118 | Exceptional 11.3% |
| Central Americans | 93.5 /100 | #119 | Exceptional 11.4% |
| Immigrants | North Macedonia | 93.5 /100 | #120 | Exceptional 11.4% |
| Immigrants | Costa Rica | 93.4 /100 | #121 | Exceptional 11.4% |
| Brazilians | 93.3 /100 | #122 | Exceptional 11.4% |
| South Africans | 92.3 /100 | #123 | Exceptional 11.4% |
| South American Indians | 92.2 /100 | #124 | Exceptional 11.4% |
| Costa Ricans | 91.9 /100 | #125 | Exceptional 11.4% |
| Immigrants | Latvia | 90.9 /100 | #126 | Exceptional 11.4% |
Demographics Similar to Spaniards by Disability
In terms of disability, the demographic groups most similar to Spaniards are Czechoslovakian (12.5%, a difference of 0.070%), U.S. Virgin Islander (12.5%, a difference of 0.24%), Immigrants from Germany (12.5%, a difference of 0.26%), Bangladeshi (12.6%, a difference of 0.33%), and Hawaiian (12.5%, a difference of 0.37%).
| Demographics | Rating | Rank | Disability |
| Immigrants | Liberia | 0.4 /100 | #260 | Tragic 12.4% |
| Scandinavians | 0.4 /100 | #261 | Tragic 12.4% |
| Native Hawaiians | 0.3 /100 | #262 | Tragic 12.5% |
| Hawaiians | 0.2 /100 | #263 | Tragic 12.5% |
| Immigrants | Germany | 0.2 /100 | #264 | Tragic 12.5% |
| U.S. Virgin Islanders | 0.2 /100 | #265 | Tragic 12.5% |
| Czechoslovakians | 0.2 /100 | #266 | Tragic 12.5% |
| Spaniards | 0.2 /100 | #267 | Tragic 12.5% |
| Bangladeshis | 0.1 /100 | #268 | Tragic 12.6% |
| Immigrants | Dominican Republic | 0.1 /100 | #269 | Tragic 12.6% |
| Portuguese | 0.1 /100 | #270 | Tragic 12.6% |
| Immigrants | Yemen | 0.1 /100 | #271 | Tragic 12.6% |
| Dominicans | 0.0 /100 | #272 | Tragic 12.7% |
| Finns | 0.0 /100 | #273 | Tragic 12.7% |
| Nepalese | 0.0 /100 | #274 | Tragic 12.8% |