Immigrants from Lithuania vs Spaniard Disability
COMPARE
Immigrants from Lithuania
Spaniard
Disability
Disability Comparison
Immigrants from Lithuania
Spaniards
10.9%
DISABILITY
99.8/ 100
METRIC RATING
56th/ 347
METRIC RANK
12.5%
DISABILITY
0.2/ 100
METRIC RATING
267th/ 347
METRIC RANK
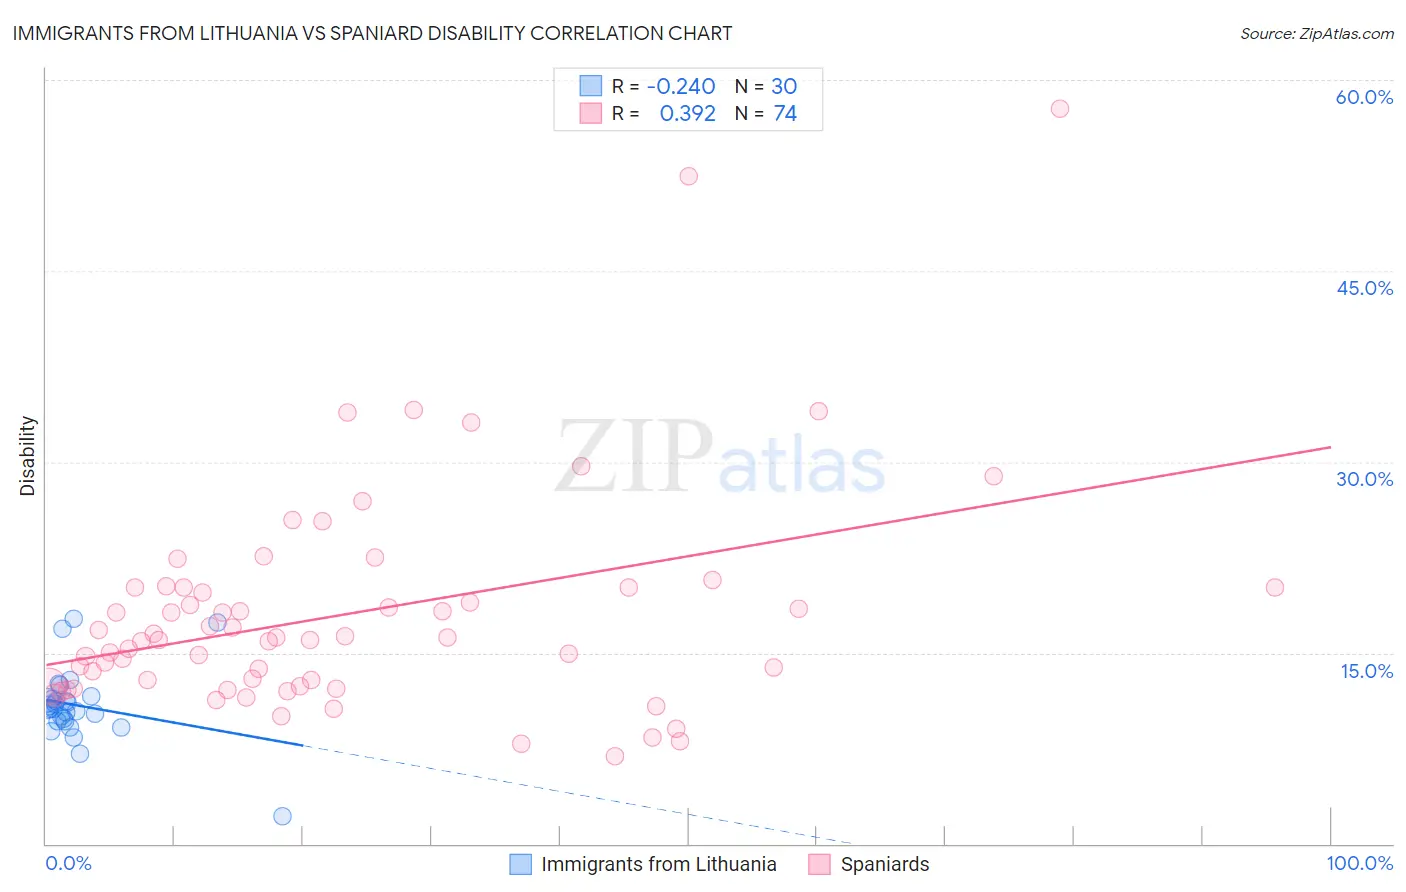
Immigrants from Lithuania vs Spaniard Disability Correlation Chart
The statistical analysis conducted on geographies consisting of 117,724,932 people shows a weak negative correlation between the proportion of Immigrants from Lithuania and percentage of population with a disability in the United States with a correlation coefficient (R) of -0.240 and weighted average of 10.9%. Similarly, the statistical analysis conducted on geographies consisting of 443,457,716 people shows a mild positive correlation between the proportion of Spaniards and percentage of population with a disability in the United States with a correlation coefficient (R) of 0.392 and weighted average of 12.5%, a difference of 15.0%.
Disability Correlation Summary
| Measurement | Immigrants from Lithuania | Spaniard |
| Minimum | 2.1% | 6.9% |
| Maximum | 17.7% | 57.8% |
| Range | 15.5% | 50.9% |
| Mean | 10.9% | 18.1% |
| Median | 10.6% | 16.1% |
| Interquartile 25% (IQ1) | 9.6% | 12.4% |
| Interquartile 75% (IQ3) | 11.4% | 20.1% |
| Interquartile Range (IQR) | 1.7% | 7.7% |
| Standard Deviation (Sample) | 2.9% | 8.8% |
| Standard Deviation (Population) | 2.9% | 8.7% |
Similar Demographics by Disability
Demographics Similar to Immigrants from Lithuania by Disability
In terms of disability, the demographic groups most similar to Immigrants from Lithuania are Immigrants from El Salvador (10.9%, a difference of 0.11%), Immigrants from Spain (10.9%, a difference of 0.20%), Jordanian (10.9%, a difference of 0.20%), South American (10.9%, a difference of 0.22%), and Salvadoran (10.9%, a difference of 0.24%).
| Demographics | Rating | Rank | Disability |
| Vietnamese | 99.9 /100 | #49 | Exceptional 10.9% |
| Immigrants | Saudi Arabia | 99.9 /100 | #50 | Exceptional 10.9% |
| Peruvians | 99.8 /100 | #51 | Exceptional 10.9% |
| South Americans | 99.8 /100 | #52 | Exceptional 10.9% |
| Immigrants | Spain | 99.8 /100 | #53 | Exceptional 10.9% |
| Jordanians | 99.8 /100 | #54 | Exceptional 10.9% |
| Immigrants | El Salvador | 99.8 /100 | #55 | Exceptional 10.9% |
| Immigrants | Lithuania | 99.8 /100 | #56 | Exceptional 10.9% |
| Salvadorans | 99.8 /100 | #57 | Exceptional 10.9% |
| Immigrants | South America | 99.8 /100 | #58 | Exceptional 10.9% |
| Immigrants | Colombia | 99.7 /100 | #59 | Exceptional 10.9% |
| Zimbabweans | 99.7 /100 | #60 | Exceptional 10.9% |
| Immigrants | Bulgaria | 99.7 /100 | #61 | Exceptional 10.9% |
| Immigrants | Northern Africa | 99.7 /100 | #62 | Exceptional 10.9% |
| Immigrants | Eritrea | 99.7 /100 | #63 | Exceptional 11.0% |
Demographics Similar to Spaniards by Disability
In terms of disability, the demographic groups most similar to Spaniards are Czechoslovakian (12.5%, a difference of 0.070%), U.S. Virgin Islander (12.5%, a difference of 0.24%), Immigrants from Germany (12.5%, a difference of 0.26%), Bangladeshi (12.6%, a difference of 0.33%), and Hawaiian (12.5%, a difference of 0.37%).
| Demographics | Rating | Rank | Disability |
| Immigrants | Liberia | 0.4 /100 | #260 | Tragic 12.4% |
| Scandinavians | 0.4 /100 | #261 | Tragic 12.4% |
| Native Hawaiians | 0.3 /100 | #262 | Tragic 12.5% |
| Hawaiians | 0.2 /100 | #263 | Tragic 12.5% |
| Immigrants | Germany | 0.2 /100 | #264 | Tragic 12.5% |
| U.S. Virgin Islanders | 0.2 /100 | #265 | Tragic 12.5% |
| Czechoslovakians | 0.2 /100 | #266 | Tragic 12.5% |
| Spaniards | 0.2 /100 | #267 | Tragic 12.5% |
| Bangladeshis | 0.1 /100 | #268 | Tragic 12.6% |
| Immigrants | Dominican Republic | 0.1 /100 | #269 | Tragic 12.6% |
| Portuguese | 0.1 /100 | #270 | Tragic 12.6% |
| Immigrants | Yemen | 0.1 /100 | #271 | Tragic 12.6% |
| Dominicans | 0.0 /100 | #272 | Tragic 12.7% |
| Finns | 0.0 /100 | #273 | Tragic 12.7% |
| Nepalese | 0.0 /100 | #274 | Tragic 12.8% |