Immigrants from Western Asia vs South African Disability
COMPARE
Immigrants from Western Asia
South African
Disability
Disability Comparison
Immigrants from Western Asia
South Africans
11.2%
DISABILITY
98.1/ 100
METRIC RATING
91st/ 347
METRIC RANK
11.4%
DISABILITY
92.3/ 100
METRIC RATING
123rd/ 347
METRIC RANK
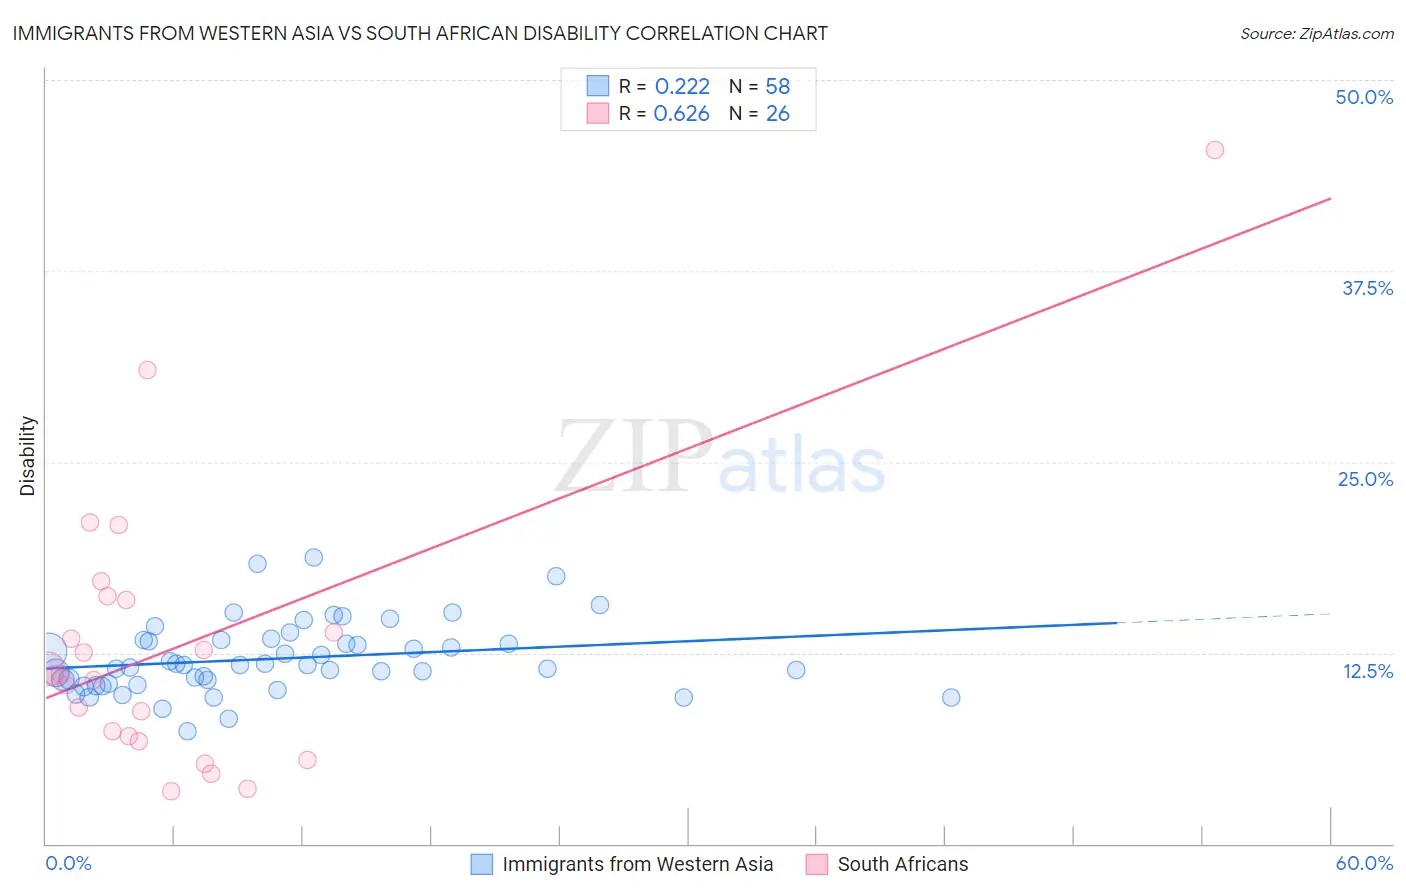
Immigrants from Western Asia vs South African Disability Correlation Chart
The statistical analysis conducted on geographies consisting of 404,425,808 people shows a weak positive correlation between the proportion of Immigrants from Western Asia and percentage of population with a disability in the United States with a correlation coefficient (R) of 0.222 and weighted average of 11.2%. Similarly, the statistical analysis conducted on geographies consisting of 182,593,286 people shows a significant positive correlation between the proportion of South Africans and percentage of population with a disability in the United States with a correlation coefficient (R) of 0.626 and weighted average of 11.4%, a difference of 1.7%.
Disability Correlation Summary
| Measurement | Immigrants from Western Asia | South African |
| Minimum | 7.4% | 3.4% |
| Maximum | 18.8% | 45.5% |
| Range | 11.4% | 42.0% |
| Mean | 12.1% | 12.9% |
| Median | 11.7% | 11.1% |
| Interquartile 25% (IQ1) | 10.5% | 7.0% |
| Interquartile 75% (IQ3) | 13.4% | 15.9% |
| Interquartile Range (IQR) | 2.8% | 8.9% |
| Standard Deviation (Sample) | 2.3% | 9.1% |
| Standard Deviation (Population) | 2.3% | 8.9% |
Similar Demographics by Disability
Demographics Similar to Immigrants from Western Asia by Disability
In terms of disability, the demographic groups most similar to Immigrants from Western Asia are Immigrants from Brazil (11.2%, a difference of 0.020%), Ecuadorian (11.2%, a difference of 0.040%), Immigrants from Ecuador (11.2%, a difference of 0.040%), Immigrants from South Africa (11.2%, a difference of 0.070%), and Immigrants from Morocco (11.2%, a difference of 0.16%).
| Demographics | Rating | Rank | Disability |
| Immigrants | Sierra Leone | 99.0 /100 | #84 | Exceptional 11.1% |
| Immigrants | Belarus | 98.9 /100 | #85 | Exceptional 11.1% |
| Immigrants | Russia | 98.9 /100 | #86 | Exceptional 11.1% |
| Palestinians | 98.9 /100 | #87 | Exceptional 11.1% |
| Immigrants | Romania | 98.5 /100 | #88 | Exceptional 11.2% |
| Immigrants | South Africa | 98.2 /100 | #89 | Exceptional 11.2% |
| Immigrants | Brazil | 98.1 /100 | #90 | Exceptional 11.2% |
| Immigrants | Western Asia | 98.1 /100 | #91 | Exceptional 11.2% |
| Ecuadorians | 98.0 /100 | #92 | Exceptional 11.2% |
| Immigrants | Ecuador | 98.0 /100 | #93 | Exceptional 11.2% |
| Immigrants | Morocco | 97.8 /100 | #94 | Exceptional 11.2% |
| Eastern Europeans | 97.8 /100 | #95 | Exceptional 11.2% |
| Immigrants | Zimbabwe | 97.7 /100 | #96 | Exceptional 11.2% |
| Bhutanese | 97.4 /100 | #97 | Exceptional 11.2% |
| Uruguayans | 97.4 /100 | #98 | Exceptional 11.2% |
Demographics Similar to South Africans by Disability
In terms of disability, the demographic groups most similar to South Africans are South American Indian (11.4%, a difference of 0.020%), Costa Rican (11.4%, a difference of 0.060%), Brazilian (11.4%, a difference of 0.17%), Immigrants from Costa Rica (11.4%, a difference of 0.20%), and Central American (11.4%, a difference of 0.21%).
| Demographics | Rating | Rank | Disability |
| Immigrants | Northern Europe | 94.1 /100 | #116 | Exceptional 11.3% |
| Luxembourgers | 93.9 /100 | #117 | Exceptional 11.3% |
| Koreans | 93.8 /100 | #118 | Exceptional 11.3% |
| Central Americans | 93.5 /100 | #119 | Exceptional 11.4% |
| Immigrants | North Macedonia | 93.5 /100 | #120 | Exceptional 11.4% |
| Immigrants | Costa Rica | 93.4 /100 | #121 | Exceptional 11.4% |
| Brazilians | 93.3 /100 | #122 | Exceptional 11.4% |
| South Africans | 92.3 /100 | #123 | Exceptional 11.4% |
| South American Indians | 92.2 /100 | #124 | Exceptional 11.4% |
| Costa Ricans | 91.9 /100 | #125 | Exceptional 11.4% |
| Immigrants | Latvia | 90.9 /100 | #126 | Exceptional 11.4% |
| Immigrants | Italy | 90.4 /100 | #127 | Exceptional 11.4% |
| Immigrants | Europe | 90.4 /100 | #128 | Exceptional 11.4% |
| Macedonians | 90.3 /100 | #129 | Exceptional 11.4% |
| Latvians | 89.8 /100 | #130 | Excellent 11.4% |