Belizean vs Spaniard Disability
COMPARE
Belizean
Spaniard
Disability
Disability Comparison
Belizeans
Spaniards
11.9%
DISABILITY
12.8/ 100
METRIC RATING
200th/ 347
METRIC RANK
12.5%
DISABILITY
0.2/ 100
METRIC RATING
267th/ 347
METRIC RANK
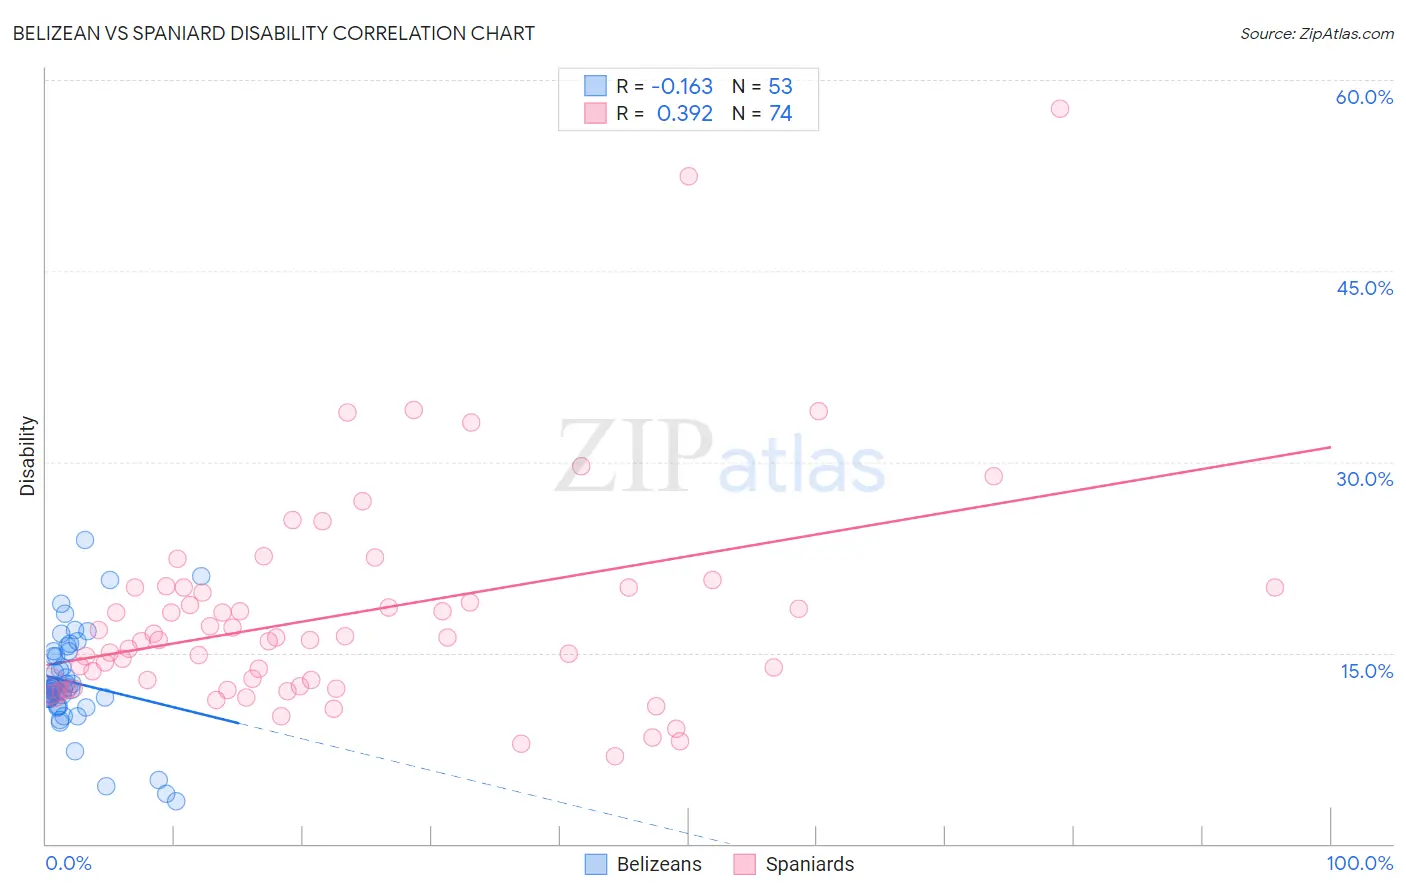
Belizean vs Spaniard Disability Correlation Chart
The statistical analysis conducted on geographies consisting of 144,197,719 people shows a poor negative correlation between the proportion of Belizeans and percentage of population with a disability in the United States with a correlation coefficient (R) of -0.163 and weighted average of 11.9%. Similarly, the statistical analysis conducted on geographies consisting of 443,457,716 people shows a mild positive correlation between the proportion of Spaniards and percentage of population with a disability in the United States with a correlation coefficient (R) of 0.392 and weighted average of 12.5%, a difference of 4.8%.
Disability Correlation Summary
| Measurement | Belizean | Spaniard |
| Minimum | 3.4% | 6.9% |
| Maximum | 23.9% | 57.8% |
| Range | 20.5% | 50.9% |
| Mean | 12.7% | 18.1% |
| Median | 12.2% | 16.1% |
| Interquartile 25% (IQ1) | 11.1% | 12.4% |
| Interquartile 75% (IQ3) | 14.9% | 20.1% |
| Interquartile Range (IQR) | 3.8% | 7.7% |
| Standard Deviation (Sample) | 3.9% | 8.8% |
| Standard Deviation (Population) | 3.9% | 8.7% |
Similar Demographics by Disability
Demographics Similar to Belizeans by Disability
In terms of disability, the demographic groups most similar to Belizeans are Assyrian/Chaldean/Syriac (11.9%, a difference of 0.020%), Immigrants from England (12.0%, a difference of 0.090%), British West Indian (12.0%, a difference of 0.14%), Mexican American Indian (12.0%, a difference of 0.14%), and Immigrants from Panama (11.9%, a difference of 0.16%).
| Demographics | Rating | Rank | Disability |
| Immigrants | Bosnia and Herzegovina | 18.0 /100 | #193 | Poor 11.9% |
| Somalis | 17.3 /100 | #194 | Poor 11.9% |
| Barbadians | 15.8 /100 | #195 | Poor 11.9% |
| Serbians | 15.4 /100 | #196 | Poor 11.9% |
| Immigrants | Belize | 15.2 /100 | #197 | Poor 11.9% |
| Ukrainians | 14.7 /100 | #198 | Poor 11.9% |
| Immigrants | Panama | 14.6 /100 | #199 | Poor 11.9% |
| Belizeans | 12.8 /100 | #200 | Poor 11.9% |
| Assyrians/Chaldeans/Syriacs | 12.6 /100 | #201 | Poor 11.9% |
| Immigrants | England | 12.0 /100 | #202 | Poor 12.0% |
| British West Indians | 11.5 /100 | #203 | Poor 12.0% |
| Mexican American Indians | 11.4 /100 | #204 | Poor 12.0% |
| Immigrants | Western Europe | 10.1 /100 | #205 | Poor 12.0% |
| Immigrants | Senegal | 9.4 /100 | #206 | Tragic 12.0% |
| Immigrants | Thailand | 9.3 /100 | #207 | Tragic 12.0% |
Demographics Similar to Spaniards by Disability
In terms of disability, the demographic groups most similar to Spaniards are Czechoslovakian (12.5%, a difference of 0.070%), U.S. Virgin Islander (12.5%, a difference of 0.24%), Immigrants from Germany (12.5%, a difference of 0.26%), Bangladeshi (12.6%, a difference of 0.33%), and Hawaiian (12.5%, a difference of 0.37%).
| Demographics | Rating | Rank | Disability |
| Immigrants | Liberia | 0.4 /100 | #260 | Tragic 12.4% |
| Scandinavians | 0.4 /100 | #261 | Tragic 12.4% |
| Native Hawaiians | 0.3 /100 | #262 | Tragic 12.5% |
| Hawaiians | 0.2 /100 | #263 | Tragic 12.5% |
| Immigrants | Germany | 0.2 /100 | #264 | Tragic 12.5% |
| U.S. Virgin Islanders | 0.2 /100 | #265 | Tragic 12.5% |
| Czechoslovakians | 0.2 /100 | #266 | Tragic 12.5% |
| Spaniards | 0.2 /100 | #267 | Tragic 12.5% |
| Bangladeshis | 0.1 /100 | #268 | Tragic 12.6% |
| Immigrants | Dominican Republic | 0.1 /100 | #269 | Tragic 12.6% |
| Portuguese | 0.1 /100 | #270 | Tragic 12.6% |
| Immigrants | Yemen | 0.1 /100 | #271 | Tragic 12.6% |
| Dominicans | 0.0 /100 | #272 | Tragic 12.7% |
| Finns | 0.0 /100 | #273 | Tragic 12.7% |
| Nepalese | 0.0 /100 | #274 | Tragic 12.8% |