Iranian vs Spaniard Disability
COMPARE
Iranian
Spaniard
Disability
Disability Comparison
Iranians
Spaniards
10.1%
DISABILITY
100.0/ 100
METRIC RATING
11th/ 347
METRIC RANK
12.5%
DISABILITY
0.2/ 100
METRIC RATING
267th/ 347
METRIC RANK
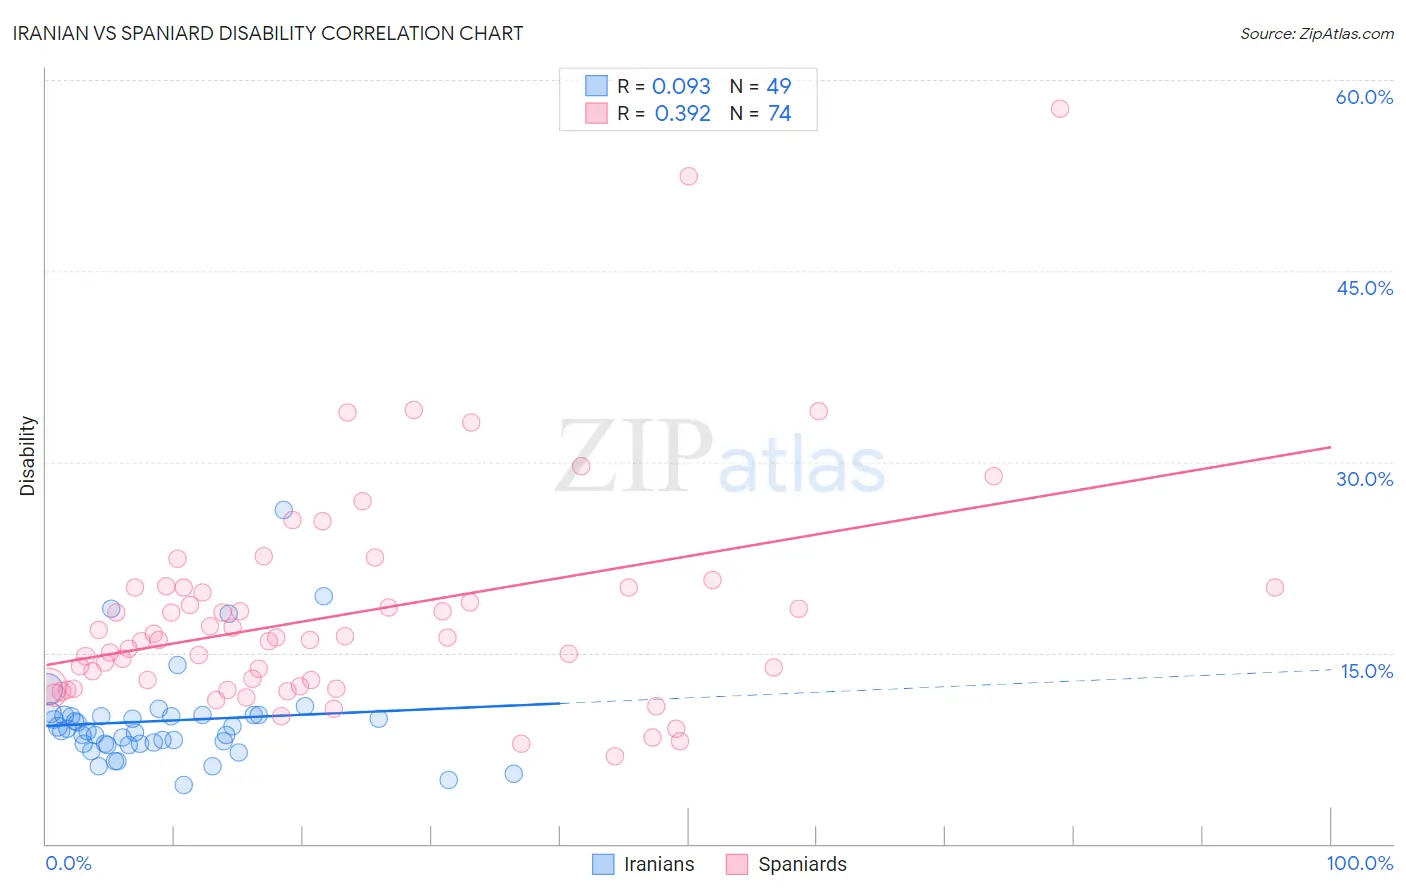
Iranian vs Spaniard Disability Correlation Chart
The statistical analysis conducted on geographies consisting of 316,882,052 people shows a slight positive correlation between the proportion of Iranians and percentage of population with a disability in the United States with a correlation coefficient (R) of 0.093 and weighted average of 10.1%. Similarly, the statistical analysis conducted on geographies consisting of 443,457,716 people shows a mild positive correlation between the proportion of Spaniards and percentage of population with a disability in the United States with a correlation coefficient (R) of 0.392 and weighted average of 12.5%, a difference of 23.8%.
Disability Correlation Summary
| Measurement | Iranian | Spaniard |
| Minimum | 4.6% | 6.9% |
| Maximum | 26.2% | 57.8% |
| Range | 21.5% | 50.9% |
| Mean | 9.7% | 18.1% |
| Median | 8.9% | 16.1% |
| Interquartile 25% (IQ1) | 7.9% | 12.4% |
| Interquartile 75% (IQ3) | 10.1% | 20.1% |
| Interquartile Range (IQR) | 2.2% | 7.7% |
| Standard Deviation (Sample) | 3.8% | 8.8% |
| Standard Deviation (Population) | 3.8% | 8.7% |
Similar Demographics by Disability
Demographics Similar to Iranians by Disability
In terms of disability, the demographic groups most similar to Iranians are Immigrants from China (10.1%, a difference of 0.010%), Immigrants from Israel (10.1%, a difference of 0.25%), Immigrants from Eastern Asia (10.2%, a difference of 0.46%), Immigrants from Hong Kong (10.0%, a difference of 0.82%), and Immigrants from Korea (10.2%, a difference of 1.1%).
| Demographics | Rating | Rank | Disability |
| Thais | 100.0 /100 | #4 | Exceptional 9.7% |
| Immigrants | Bolivia | 100.0 /100 | #5 | Exceptional 9.9% |
| Immigrants | South Central Asia | 100.0 /100 | #6 | Exceptional 9.9% |
| Immigrants | Singapore | 100.0 /100 | #7 | Exceptional 10.0% |
| Bolivians | 100.0 /100 | #8 | Exceptional 10.0% |
| Immigrants | Hong Kong | 100.0 /100 | #9 | Exceptional 10.0% |
| Immigrants | China | 100.0 /100 | #10 | Exceptional 10.1% |
| Iranians | 100.0 /100 | #11 | Exceptional 10.1% |
| Immigrants | Israel | 100.0 /100 | #12 | Exceptional 10.1% |
| Immigrants | Eastern Asia | 100.0 /100 | #13 | Exceptional 10.2% |
| Immigrants | Korea | 100.0 /100 | #14 | Exceptional 10.2% |
| Okinawans | 100.0 /100 | #15 | Exceptional 10.3% |
| Indians (Asian) | 100.0 /100 | #16 | Exceptional 10.3% |
| Immigrants | Iran | 100.0 /100 | #17 | Exceptional 10.3% |
| Burmese | 100.0 /100 | #18 | Exceptional 10.4% |
Demographics Similar to Spaniards by Disability
In terms of disability, the demographic groups most similar to Spaniards are Czechoslovakian (12.5%, a difference of 0.070%), U.S. Virgin Islander (12.5%, a difference of 0.24%), Immigrants from Germany (12.5%, a difference of 0.26%), Bangladeshi (12.6%, a difference of 0.33%), and Hawaiian (12.5%, a difference of 0.37%).
| Demographics | Rating | Rank | Disability |
| Immigrants | Liberia | 0.4 /100 | #260 | Tragic 12.4% |
| Scandinavians | 0.4 /100 | #261 | Tragic 12.4% |
| Native Hawaiians | 0.3 /100 | #262 | Tragic 12.5% |
| Hawaiians | 0.2 /100 | #263 | Tragic 12.5% |
| Immigrants | Germany | 0.2 /100 | #264 | Tragic 12.5% |
| U.S. Virgin Islanders | 0.2 /100 | #265 | Tragic 12.5% |
| Czechoslovakians | 0.2 /100 | #266 | Tragic 12.5% |
| Spaniards | 0.2 /100 | #267 | Tragic 12.5% |
| Bangladeshis | 0.1 /100 | #268 | Tragic 12.6% |
| Immigrants | Dominican Republic | 0.1 /100 | #269 | Tragic 12.6% |
| Portuguese | 0.1 /100 | #270 | Tragic 12.6% |
| Immigrants | Yemen | 0.1 /100 | #271 | Tragic 12.6% |
| Dominicans | 0.0 /100 | #272 | Tragic 12.7% |
| Finns | 0.0 /100 | #273 | Tragic 12.7% |
| Nepalese | 0.0 /100 | #274 | Tragic 12.8% |