Peruvian vs Spaniard Disability
COMPARE
Peruvian
Spaniard
Disability
Disability Comparison
Peruvians
Spaniards
10.9%
DISABILITY
99.8/ 100
METRIC RATING
51st/ 347
METRIC RANK
12.5%
DISABILITY
0.2/ 100
METRIC RATING
267th/ 347
METRIC RANK
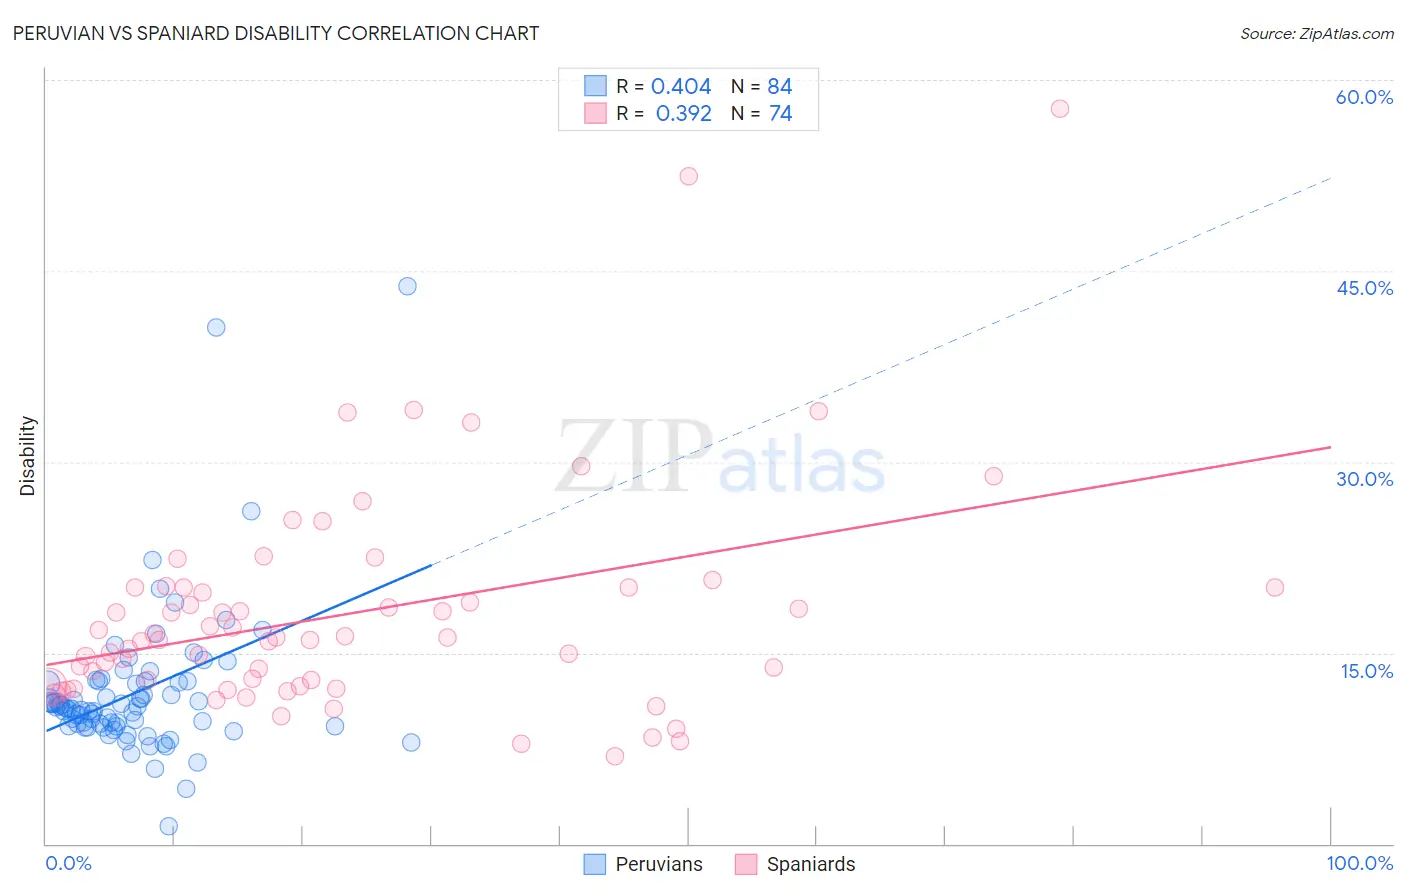
Peruvian vs Spaniard Disability Correlation Chart
The statistical analysis conducted on geographies consisting of 363,197,931 people shows a moderate positive correlation between the proportion of Peruvians and percentage of population with a disability in the United States with a correlation coefficient (R) of 0.404 and weighted average of 10.9%. Similarly, the statistical analysis conducted on geographies consisting of 443,457,716 people shows a mild positive correlation between the proportion of Spaniards and percentage of population with a disability in the United States with a correlation coefficient (R) of 0.392 and weighted average of 12.5%, a difference of 15.3%.
Disability Correlation Summary
| Measurement | Peruvian | Spaniard |
| Minimum | 1.4% | 6.9% |
| Maximum | 43.8% | 57.8% |
| Range | 42.4% | 50.9% |
| Mean | 11.9% | 18.1% |
| Median | 10.7% | 16.1% |
| Interquartile 25% (IQ1) | 9.2% | 12.4% |
| Interquartile 75% (IQ3) | 12.7% | 20.1% |
| Interquartile Range (IQR) | 3.5% | 7.7% |
| Standard Deviation (Sample) | 6.0% | 8.8% |
| Standard Deviation (Population) | 5.9% | 8.7% |
Similar Demographics by Disability
Demographics Similar to Peruvians by Disability
In terms of disability, the demographic groups most similar to Peruvians are Vietnamese (10.9%, a difference of 0.010%), Immigrants from Saudi Arabia (10.9%, a difference of 0.010%), South American (10.9%, a difference of 0.060%), Soviet Union (10.9%, a difference of 0.070%), and Immigrants from Spain (10.9%, a difference of 0.080%).
| Demographics | Rating | Rank | Disability |
| Immigrants | Japan | 99.9 /100 | #44 | Exceptional 10.8% |
| Immigrants | Peru | 99.9 /100 | #45 | Exceptional 10.8% |
| Tongans | 99.9 /100 | #46 | Exceptional 10.8% |
| Taiwanese | 99.9 /100 | #47 | Exceptional 10.8% |
| Soviet Union | 99.9 /100 | #48 | Exceptional 10.9% |
| Vietnamese | 99.9 /100 | #49 | Exceptional 10.9% |
| Immigrants | Saudi Arabia | 99.9 /100 | #50 | Exceptional 10.9% |
| Peruvians | 99.8 /100 | #51 | Exceptional 10.9% |
| South Americans | 99.8 /100 | #52 | Exceptional 10.9% |
| Immigrants | Spain | 99.8 /100 | #53 | Exceptional 10.9% |
| Jordanians | 99.8 /100 | #54 | Exceptional 10.9% |
| Immigrants | El Salvador | 99.8 /100 | #55 | Exceptional 10.9% |
| Immigrants | Lithuania | 99.8 /100 | #56 | Exceptional 10.9% |
| Salvadorans | 99.8 /100 | #57 | Exceptional 10.9% |
| Immigrants | South America | 99.8 /100 | #58 | Exceptional 10.9% |
Demographics Similar to Spaniards by Disability
In terms of disability, the demographic groups most similar to Spaniards are Czechoslovakian (12.5%, a difference of 0.070%), U.S. Virgin Islander (12.5%, a difference of 0.24%), Immigrants from Germany (12.5%, a difference of 0.26%), Bangladeshi (12.6%, a difference of 0.33%), and Hawaiian (12.5%, a difference of 0.37%).
| Demographics | Rating | Rank | Disability |
| Immigrants | Liberia | 0.4 /100 | #260 | Tragic 12.4% |
| Scandinavians | 0.4 /100 | #261 | Tragic 12.4% |
| Native Hawaiians | 0.3 /100 | #262 | Tragic 12.5% |
| Hawaiians | 0.2 /100 | #263 | Tragic 12.5% |
| Immigrants | Germany | 0.2 /100 | #264 | Tragic 12.5% |
| U.S. Virgin Islanders | 0.2 /100 | #265 | Tragic 12.5% |
| Czechoslovakians | 0.2 /100 | #266 | Tragic 12.5% |
| Spaniards | 0.2 /100 | #267 | Tragic 12.5% |
| Bangladeshis | 0.1 /100 | #268 | Tragic 12.6% |
| Immigrants | Dominican Republic | 0.1 /100 | #269 | Tragic 12.6% |
| Portuguese | 0.1 /100 | #270 | Tragic 12.6% |
| Immigrants | Yemen | 0.1 /100 | #271 | Tragic 12.6% |
| Dominicans | 0.0 /100 | #272 | Tragic 12.7% |
| Finns | 0.0 /100 | #273 | Tragic 12.7% |
| Nepalese | 0.0 /100 | #274 | Tragic 12.8% |