Immigrants from West Indies vs Tongan Hearing Disability
COMPARE
Immigrants from West Indies
Tongan
Hearing Disability
Hearing Disability Comparison
Immigrants from West Indies
Tongans
2.5%
HEARING DISABILITY
99.9/ 100
METRIC RATING
16th/ 347
METRIC RANK
2.9%
HEARING DISABILITY
78.6/ 100
METRIC RATING
147th/ 347
METRIC RANK
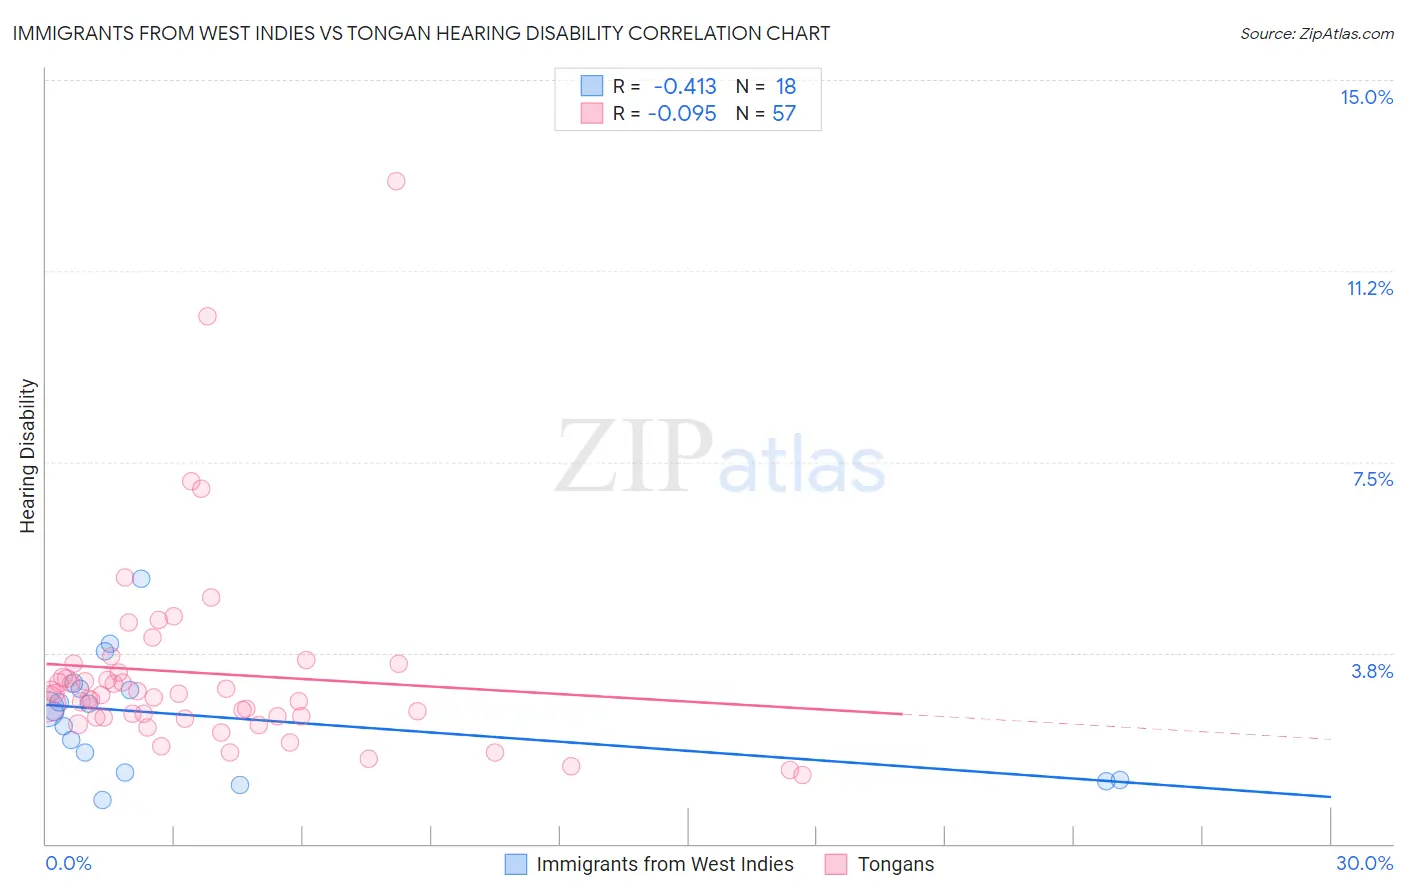
Immigrants from West Indies vs Tongan Hearing Disability Correlation Chart
The statistical analysis conducted on geographies consisting of 72,456,124 people shows a moderate negative correlation between the proportion of Immigrants from West Indies and percentage of population with hearing disability in the United States with a correlation coefficient (R) of -0.413 and weighted average of 2.5%. Similarly, the statistical analysis conducted on geographies consisting of 102,876,442 people shows a slight negative correlation between the proportion of Tongans and percentage of population with hearing disability in the United States with a correlation coefficient (R) of -0.095 and weighted average of 2.9%, a difference of 15.2%.
Hearing Disability Correlation Summary
| Measurement | Immigrants from West Indies | Tongan |
| Minimum | 0.87% | 1.4% |
| Maximum | 5.2% | 13.0% |
| Range | 4.3% | 11.7% |
| Mean | 2.5% | 3.3% |
| Median | 2.6% | 2.9% |
| Interquartile 25% (IQ1) | 1.4% | 2.5% |
| Interquartile 75% (IQ3) | 3.0% | 3.4% |
| Interquartile Range (IQR) | 1.6% | 0.97% |
| Standard Deviation (Sample) | 1.1% | 2.0% |
| Standard Deviation (Population) | 1.1% | 1.9% |
Similar Demographics by Hearing Disability
Demographics Similar to Immigrants from West Indies by Hearing Disability
In terms of hearing disability, the demographic groups most similar to Immigrants from West Indies are Barbadian (2.5%, a difference of 0.15%), Immigrants from India (2.5%, a difference of 0.32%), Ecuadorian (2.5%, a difference of 0.45%), Sierra Leonean (2.5%, a difference of 0.77%), and Trinidadian and Tobagonian (2.5%, a difference of 1.0%).
| Demographics | Rating | Rank | Hearing Disability |
| Immigrants | Dominican Republic | 100.0 /100 | #9 | Exceptional 2.4% |
| Immigrants | Ecuador | 99.9 /100 | #10 | Exceptional 2.5% |
| Immigrants | Trinidad and Tobago | 99.9 /100 | #11 | Exceptional 2.5% |
| Trinidadians and Tobagonians | 99.9 /100 | #12 | Exceptional 2.5% |
| Sierra Leoneans | 99.9 /100 | #13 | Exceptional 2.5% |
| Ecuadorians | 99.9 /100 | #14 | Exceptional 2.5% |
| Barbadians | 99.9 /100 | #15 | Exceptional 2.5% |
| Immigrants | West Indies | 99.9 /100 | #16 | Exceptional 2.5% |
| Immigrants | India | 99.9 /100 | #17 | Exceptional 2.5% |
| Dominicans | 99.8 /100 | #18 | Exceptional 2.5% |
| Thais | 99.8 /100 | #19 | Exceptional 2.5% |
| Immigrants | Bolivia | 99.8 /100 | #20 | Exceptional 2.5% |
| Ghanaians | 99.8 /100 | #21 | Exceptional 2.5% |
| Immigrants | Sierra Leone | 99.8 /100 | #22 | Exceptional 2.6% |
| Immigrants | Nigeria | 99.8 /100 | #23 | Exceptional 2.6% |
Demographics Similar to Tongans by Hearing Disability
In terms of hearing disability, the demographic groups most similar to Tongans are Brazilian (2.9%, a difference of 0.010%), Immigrants from Congo (2.9%, a difference of 0.030%), Immigrants from Bulgaria (2.9%, a difference of 0.080%), Immigrants from Russia (2.9%, a difference of 0.13%), and Immigrants from Panama (2.9%, a difference of 0.25%).
| Demographics | Rating | Rank | Hearing Disability |
| Immigrants | Jordan | 83.7 /100 | #140 | Excellent 2.9% |
| Sub-Saharan Africans | 83.3 /100 | #141 | Excellent 2.9% |
| Laotians | 81.1 /100 | #142 | Excellent 2.9% |
| Immigrants | Bahamas | 80.9 /100 | #143 | Excellent 2.9% |
| Immigrants | Bulgaria | 79.2 /100 | #144 | Good 2.9% |
| Immigrants | Congo | 78.9 /100 | #145 | Good 2.9% |
| Brazilians | 78.7 /100 | #146 | Good 2.9% |
| Tongans | 78.6 /100 | #147 | Good 2.9% |
| Immigrants | Russia | 77.7 /100 | #148 | Good 2.9% |
| Immigrants | Panama | 76.9 /100 | #149 | Good 2.9% |
| Palestinians | 73.6 /100 | #150 | Good 2.9% |
| Immigrants | France | 73.1 /100 | #151 | Good 2.9% |
| Immigrants | Lithuania | 73.0 /100 | #152 | Good 2.9% |
| Sudanese | 72.1 /100 | #153 | Good 2.9% |
| Immigrants | Lebanon | 71.5 /100 | #154 | Good 2.9% |