Immigrants from West Indies vs Arab Hearing Disability
COMPARE
Immigrants from West Indies
Arab
Hearing Disability
Hearing Disability Comparison
Immigrants from West Indies
Arabs
2.5%
HEARING DISABILITY
99.9/ 100
METRIC RATING
16th/ 347
METRIC RANK
3.0%
HEARING DISABILITY
57.6/ 100
METRIC RATING
169th/ 347
METRIC RANK
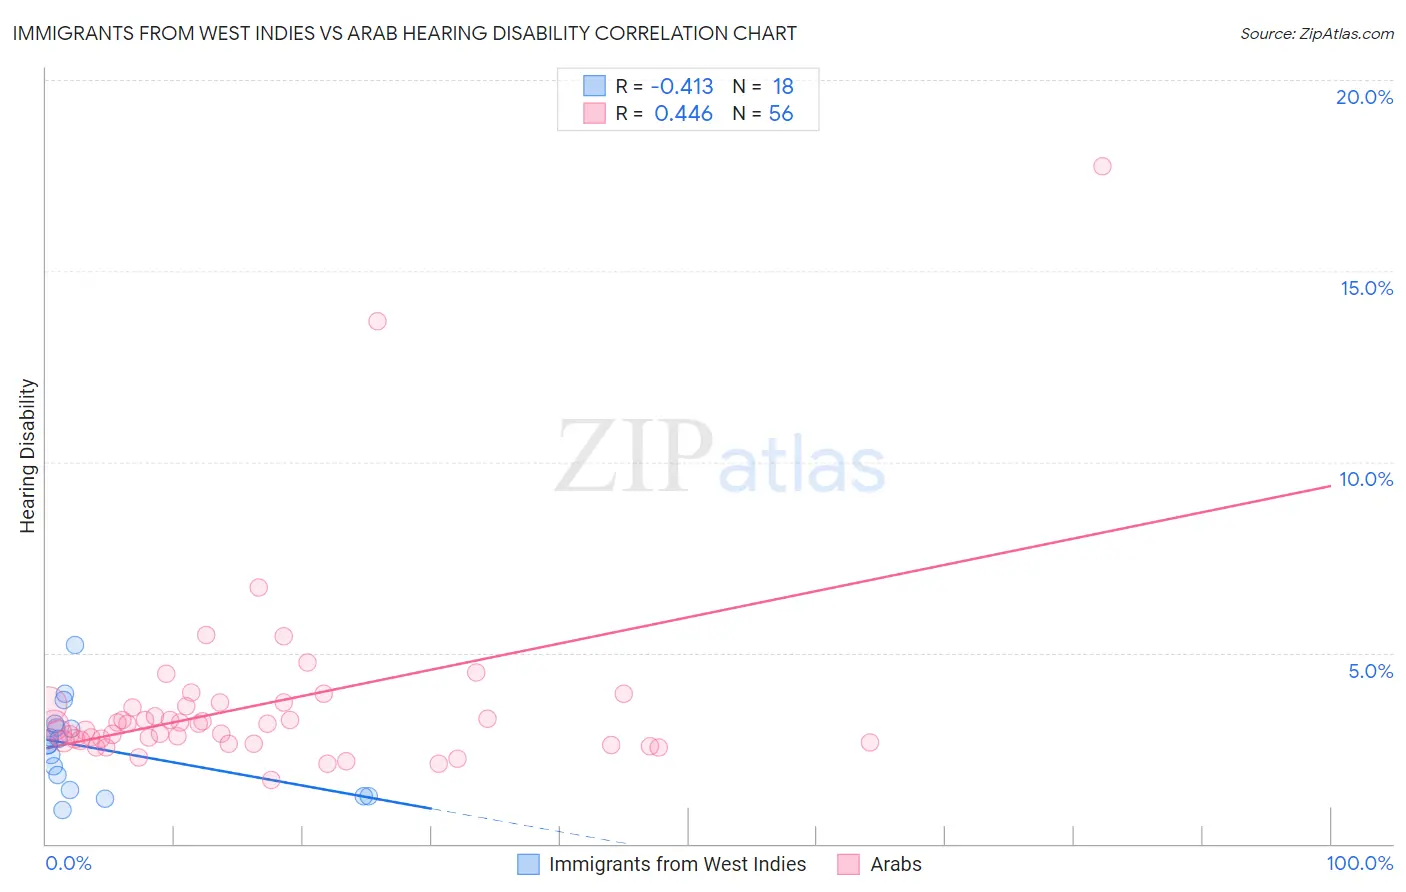
Immigrants from West Indies vs Arab Hearing Disability Correlation Chart
The statistical analysis conducted on geographies consisting of 72,456,124 people shows a moderate negative correlation between the proportion of Immigrants from West Indies and percentage of population with hearing disability in the United States with a correlation coefficient (R) of -0.413 and weighted average of 2.5%. Similarly, the statistical analysis conducted on geographies consisting of 486,579,834 people shows a moderate positive correlation between the proportion of Arabs and percentage of population with hearing disability in the United States with a correlation coefficient (R) of 0.446 and weighted average of 3.0%, a difference of 18.0%.
Hearing Disability Correlation Summary
| Measurement | Immigrants from West Indies | Arab |
| Minimum | 0.87% | 1.7% |
| Maximum | 5.2% | 17.8% |
| Range | 4.3% | 16.1% |
| Mean | 2.5% | 3.6% |
| Median | 2.6% | 3.1% |
| Interquartile 25% (IQ1) | 1.4% | 2.7% |
| Interquartile 75% (IQ3) | 3.0% | 3.6% |
| Interquartile Range (IQR) | 1.6% | 0.96% |
| Standard Deviation (Sample) | 1.1% | 2.5% |
| Standard Deviation (Population) | 1.1% | 2.5% |
Similar Demographics by Hearing Disability
Demographics Similar to Immigrants from West Indies by Hearing Disability
In terms of hearing disability, the demographic groups most similar to Immigrants from West Indies are Barbadian (2.5%, a difference of 0.15%), Immigrants from India (2.5%, a difference of 0.32%), Ecuadorian (2.5%, a difference of 0.45%), Sierra Leonean (2.5%, a difference of 0.77%), and Trinidadian and Tobagonian (2.5%, a difference of 1.0%).
| Demographics | Rating | Rank | Hearing Disability |
| Immigrants | Dominican Republic | 100.0 /100 | #9 | Exceptional 2.4% |
| Immigrants | Ecuador | 99.9 /100 | #10 | Exceptional 2.5% |
| Immigrants | Trinidad and Tobago | 99.9 /100 | #11 | Exceptional 2.5% |
| Trinidadians and Tobagonians | 99.9 /100 | #12 | Exceptional 2.5% |
| Sierra Leoneans | 99.9 /100 | #13 | Exceptional 2.5% |
| Ecuadorians | 99.9 /100 | #14 | Exceptional 2.5% |
| Barbadians | 99.9 /100 | #15 | Exceptional 2.5% |
| Immigrants | West Indies | 99.9 /100 | #16 | Exceptional 2.5% |
| Immigrants | India | 99.9 /100 | #17 | Exceptional 2.5% |
| Dominicans | 99.8 /100 | #18 | Exceptional 2.5% |
| Thais | 99.8 /100 | #19 | Exceptional 2.5% |
| Immigrants | Bolivia | 99.8 /100 | #20 | Exceptional 2.5% |
| Ghanaians | 99.8 /100 | #21 | Exceptional 2.5% |
| Immigrants | Sierra Leone | 99.8 /100 | #22 | Exceptional 2.6% |
| Immigrants | Nigeria | 99.8 /100 | #23 | Exceptional 2.6% |
Demographics Similar to Arabs by Hearing Disability
In terms of hearing disability, the demographic groups most similar to Arabs are Immigrants from Greece (3.0%, a difference of 0.030%), Immigrants from Eastern Europe (3.0%, a difference of 0.040%), Immigrants from Cabo Verde (3.0%, a difference of 0.070%), Immigrants from Ukraine (3.0%, a difference of 0.10%), and Armenian (3.0%, a difference of 0.15%).
| Demographics | Rating | Rank | Hearing Disability |
| Immigrants | Japan | 66.3 /100 | #162 | Good 2.9% |
| Immigrants | Central America | 64.9 /100 | #163 | Good 3.0% |
| Immigrants | Cambodia | 64.8 /100 | #164 | Good 3.0% |
| Immigrants | Zimbabwe | 64.2 /100 | #165 | Good 3.0% |
| Immigrants | South Eastern Asia | 62.9 /100 | #166 | Good 3.0% |
| Immigrants | Eastern Europe | 58.1 /100 | #167 | Average 3.0% |
| Immigrants | Greece | 57.9 /100 | #168 | Average 3.0% |
| Arabs | 57.6 /100 | #169 | Average 3.0% |
| Immigrants | Cabo Verde | 56.9 /100 | #170 | Average 3.0% |
| Immigrants | Ukraine | 56.6 /100 | #171 | Average 3.0% |
| Armenians | 56.0 /100 | #172 | Average 3.0% |
| Immigrants | Serbia | 51.1 /100 | #173 | Average 3.0% |
| Indonesians | 50.0 /100 | #174 | Average 3.0% |
| Immigrants | Romania | 48.4 /100 | #175 | Average 3.0% |
| Panamanians | 47.0 /100 | #176 | Average 3.0% |