Immigrants from Eastern Europe vs Tongan Hearing Disability
COMPARE
Immigrants from Eastern Europe
Tongan
Hearing Disability
Hearing Disability Comparison
Immigrants from Eastern Europe
Tongans
3.0%
HEARING DISABILITY
58.1/ 100
METRIC RATING
167th/ 347
METRIC RANK
2.9%
HEARING DISABILITY
78.6/ 100
METRIC RATING
147th/ 347
METRIC RANK
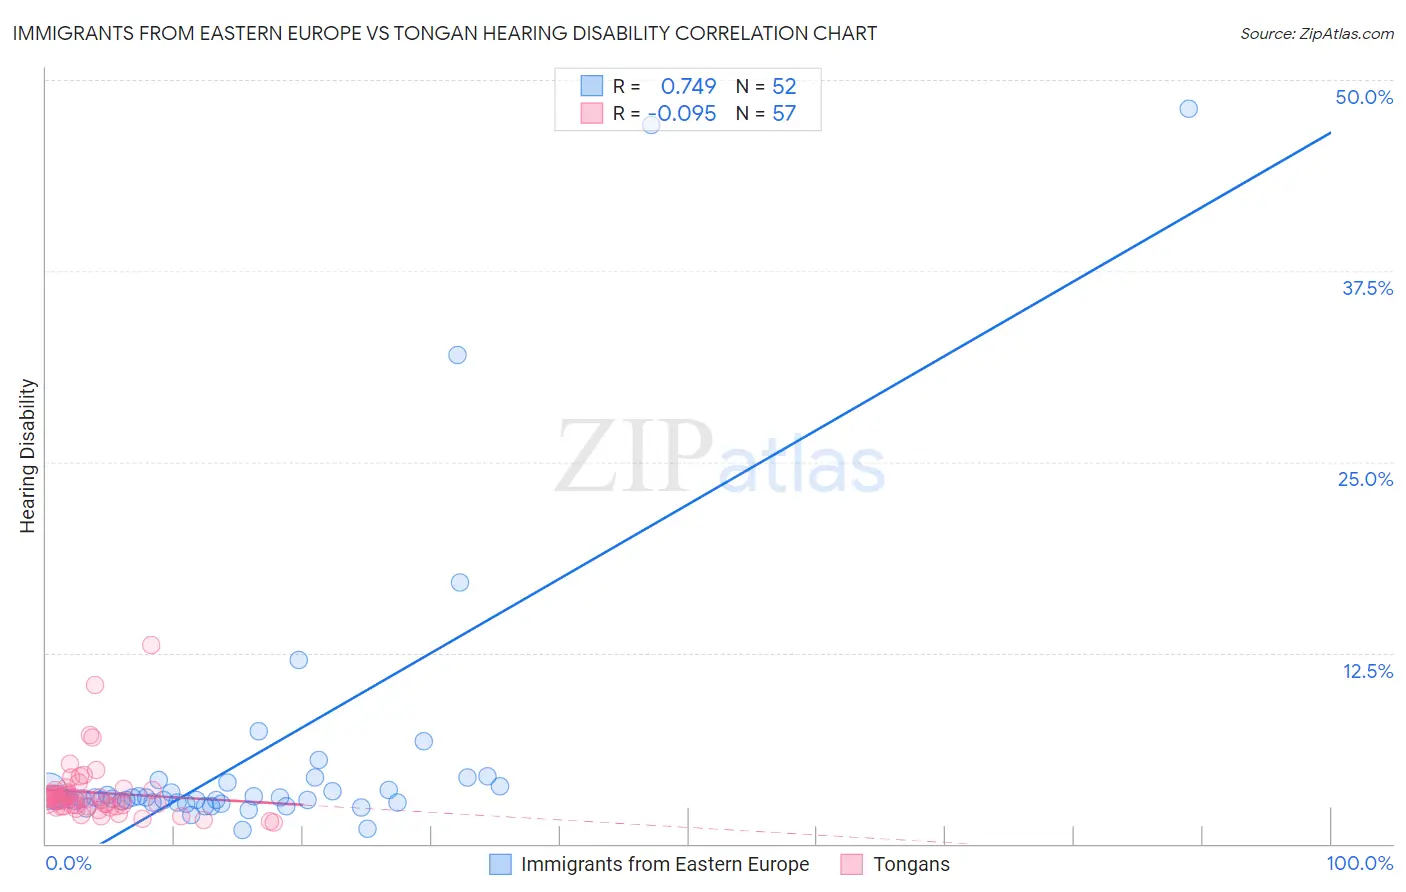
Immigrants from Eastern Europe vs Tongan Hearing Disability Correlation Chart
The statistical analysis conducted on geographies consisting of 475,611,830 people shows a strong positive correlation between the proportion of Immigrants from Eastern Europe and percentage of population with hearing disability in the United States with a correlation coefficient (R) of 0.749 and weighted average of 3.0%. Similarly, the statistical analysis conducted on geographies consisting of 102,876,442 people shows a slight negative correlation between the proportion of Tongans and percentage of population with hearing disability in the United States with a correlation coefficient (R) of -0.095 and weighted average of 2.9%, a difference of 2.4%.
Hearing Disability Correlation Summary
| Measurement | Immigrants from Eastern Europe | Tongan |
| Minimum | 0.94% | 1.4% |
| Maximum | 48.1% | 13.0% |
| Range | 47.2% | 11.7% |
| Mean | 5.9% | 3.3% |
| Median | 3.0% | 2.9% |
| Interquartile 25% (IQ1) | 2.7% | 2.5% |
| Interquartile 75% (IQ3) | 3.9% | 3.4% |
| Interquartile Range (IQR) | 1.2% | 0.97% |
| Standard Deviation (Sample) | 9.6% | 2.0% |
| Standard Deviation (Population) | 9.5% | 1.9% |
Demographics Similar to Immigrants from Eastern Europe and Tongans by Hearing Disability
In terms of hearing disability, the demographic groups most similar to Immigrants from Eastern Europe are Immigrants from South Eastern Asia (3.0%, a difference of 0.47%), Immigrants from Zimbabwe (3.0%, a difference of 0.61%), Immigrants from Cambodia (3.0%, a difference of 0.67%), Immigrants from Central America (3.0%, a difference of 0.69%), and Immigrants from Japan (2.9%, a difference of 0.84%). Similarly, the demographic groups most similar to Tongans are Immigrants from Russia (2.9%, a difference of 0.13%), Immigrants from Panama (2.9%, a difference of 0.25%), Palestinian (2.9%, a difference of 0.67%), Immigrants from France (2.9%, a difference of 0.73%), and Immigrants from Lithuania (2.9%, a difference of 0.75%).
| Demographics | Rating | Rank | Hearing Disability |
| Tongans | 78.6 /100 | #147 | Good 2.9% |
| Immigrants | Russia | 77.7 /100 | #148 | Good 2.9% |
| Immigrants | Panama | 76.9 /100 | #149 | Good 2.9% |
| Palestinians | 73.6 /100 | #150 | Good 2.9% |
| Immigrants | France | 73.1 /100 | #151 | Good 2.9% |
| Immigrants | Lithuania | 73.0 /100 | #152 | Good 2.9% |
| Sudanese | 72.1 /100 | #153 | Good 2.9% |
| Immigrants | Lebanon | 71.5 /100 | #154 | Good 2.9% |
| Costa Ricans | 71.4 /100 | #155 | Good 2.9% |
| Immigrants | Poland | 70.2 /100 | #156 | Good 2.9% |
| Immigrants | Kazakhstan | 69.6 /100 | #157 | Good 2.9% |
| Immigrants | Burma/Myanmar | 69.5 /100 | #158 | Good 2.9% |
| Immigrants | Australia | 67.4 /100 | #159 | Good 2.9% |
| Immigrants | Fiji | 67.1 /100 | #160 | Good 2.9% |
| Albanians | 66.6 /100 | #161 | Good 2.9% |
| Immigrants | Japan | 66.3 /100 | #162 | Good 2.9% |
| Immigrants | Central America | 64.9 /100 | #163 | Good 3.0% |
| Immigrants | Cambodia | 64.8 /100 | #164 | Good 3.0% |
| Immigrants | Zimbabwe | 64.2 /100 | #165 | Good 3.0% |
| Immigrants | South Eastern Asia | 62.9 /100 | #166 | Good 3.0% |
| Immigrants | Eastern Europe | 58.1 /100 | #167 | Average 3.0% |