Immigrants from West Indies vs Tongan Family Poverty
COMPARE
Immigrants from West Indies
Tongan
Family Poverty
Family Poverty Comparison
Immigrants from West Indies
Tongans
11.3%
FAMILY POVERTY
0.0/ 100
METRIC RATING
281st/ 347
METRIC RANK
7.7%
FAMILY POVERTY
98.9/ 100
METRIC RATING
46th/ 347
METRIC RANK
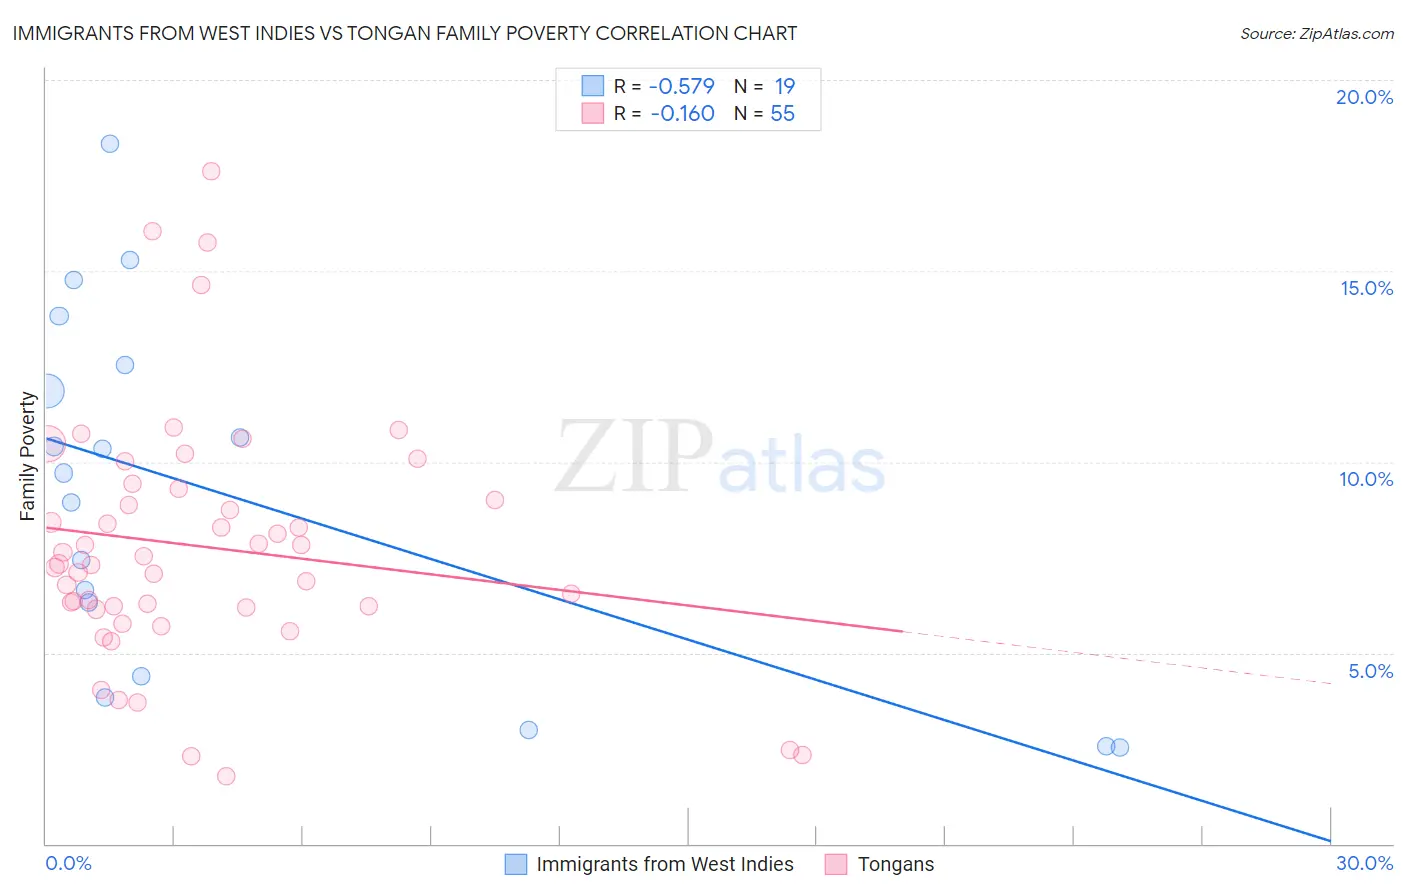
Immigrants from West Indies vs Tongan Family Poverty Correlation Chart
The statistical analysis conducted on geographies consisting of 72,448,648 people shows a substantial negative correlation between the proportion of Immigrants from West Indies and poverty level among families in the United States with a correlation coefficient (R) of -0.579 and weighted average of 11.3%. Similarly, the statistical analysis conducted on geographies consisting of 102,821,565 people shows a poor negative correlation between the proportion of Tongans and poverty level among families in the United States with a correlation coefficient (R) of -0.160 and weighted average of 7.7%, a difference of 47.3%.
Family Poverty Correlation Summary
| Measurement | Immigrants from West Indies | Tongan |
| Minimum | 2.5% | 1.8% |
| Maximum | 18.3% | 17.6% |
| Range | 15.8% | 15.9% |
| Mean | 9.1% | 7.8% |
| Median | 9.7% | 7.3% |
| Interquartile 25% (IQ1) | 4.4% | 6.2% |
| Interquartile 75% (IQ3) | 12.6% | 9.3% |
| Interquartile Range (IQR) | 8.2% | 3.1% |
| Standard Deviation (Sample) | 4.7% | 3.2% |
| Standard Deviation (Population) | 4.5% | 3.2% |
Similar Demographics by Family Poverty
Demographics Similar to Immigrants from West Indies by Family Poverty
In terms of family poverty, the demographic groups most similar to Immigrants from West Indies are Immigrants from Cuba (11.3%, a difference of 0.26%), Belizean (11.3%, a difference of 0.27%), Indonesian (11.3%, a difference of 0.30%), Blackfeet (11.3%, a difference of 0.31%), and Yaqui (11.3%, a difference of 0.42%).
| Demographics | Rating | Rank | Family Poverty |
| Spanish Americans | 0.1 /100 | #274 | Tragic 11.2% |
| Central Americans | 0.1 /100 | #275 | Tragic 11.2% |
| Immigrants | Guyana | 0.1 /100 | #276 | Tragic 11.2% |
| Chippewa | 0.1 /100 | #277 | Tragic 11.2% |
| Guyanese | 0.1 /100 | #278 | Tragic 11.2% |
| Blackfeet | 0.0 /100 | #279 | Tragic 11.3% |
| Belizeans | 0.0 /100 | #280 | Tragic 11.3% |
| Immigrants | West Indies | 0.0 /100 | #281 | Tragic 11.3% |
| Immigrants | Cuba | 0.0 /100 | #282 | Tragic 11.3% |
| Indonesians | 0.0 /100 | #283 | Tragic 11.3% |
| Yaqui | 0.0 /100 | #284 | Tragic 11.3% |
| Barbadians | 0.0 /100 | #285 | Tragic 11.3% |
| Senegalese | 0.0 /100 | #286 | Tragic 11.5% |
| Vietnamese | 0.0 /100 | #287 | Tragic 11.5% |
| Immigrants | Belize | 0.0 /100 | #288 | Tragic 11.5% |
Demographics Similar to Tongans by Family Poverty
In terms of family poverty, the demographic groups most similar to Tongans are Okinawan (7.7%, a difference of 0.010%), Immigrants from Czechoslovakia (7.7%, a difference of 0.010%), Immigrants from Sri Lanka (7.7%, a difference of 0.030%), German (7.7%, a difference of 0.14%), and Immigrants from Bolivia (7.7%, a difference of 0.22%).
| Demographics | Rating | Rank | Family Poverty |
| Carpatho Rusyns | 99.3 /100 | #39 | Exceptional 7.5% |
| Slovenes | 99.3 /100 | #40 | Exceptional 7.5% |
| Immigrants | Australia | 99.2 /100 | #41 | Exceptional 7.6% |
| Scandinavians | 99.1 /100 | #42 | Exceptional 7.6% |
| Immigrants | Austria | 99.1 /100 | #43 | Exceptional 7.6% |
| Germans | 99.0 /100 | #44 | Exceptional 7.7% |
| Okinawans | 98.9 /100 | #45 | Exceptional 7.7% |
| Tongans | 98.9 /100 | #46 | Exceptional 7.7% |
| Immigrants | Czechoslovakia | 98.9 /100 | #47 | Exceptional 7.7% |
| Immigrants | Sri Lanka | 98.9 /100 | #48 | Exceptional 7.7% |
| Immigrants | Bolivia | 98.9 /100 | #49 | Exceptional 7.7% |
| Immigrants | North Macedonia | 98.9 /100 | #50 | Exceptional 7.7% |
| Immigrants | Moldova | 98.8 /100 | #51 | Exceptional 7.7% |
| Indians (Asian) | 98.8 /100 | #52 | Exceptional 7.7% |
| Swiss | 98.8 /100 | #53 | Exceptional 7.7% |