Immigrants from Eastern Asia vs Tongan Hearing Disability
COMPARE
Immigrants from Eastern Asia
Tongan
Hearing Disability
Hearing Disability Comparison
Immigrants from Eastern Asia
Tongans
2.7%
HEARING DISABILITY
99.0/ 100
METRIC RATING
53rd/ 347
METRIC RANK
2.9%
HEARING DISABILITY
78.6/ 100
METRIC RATING
147th/ 347
METRIC RANK
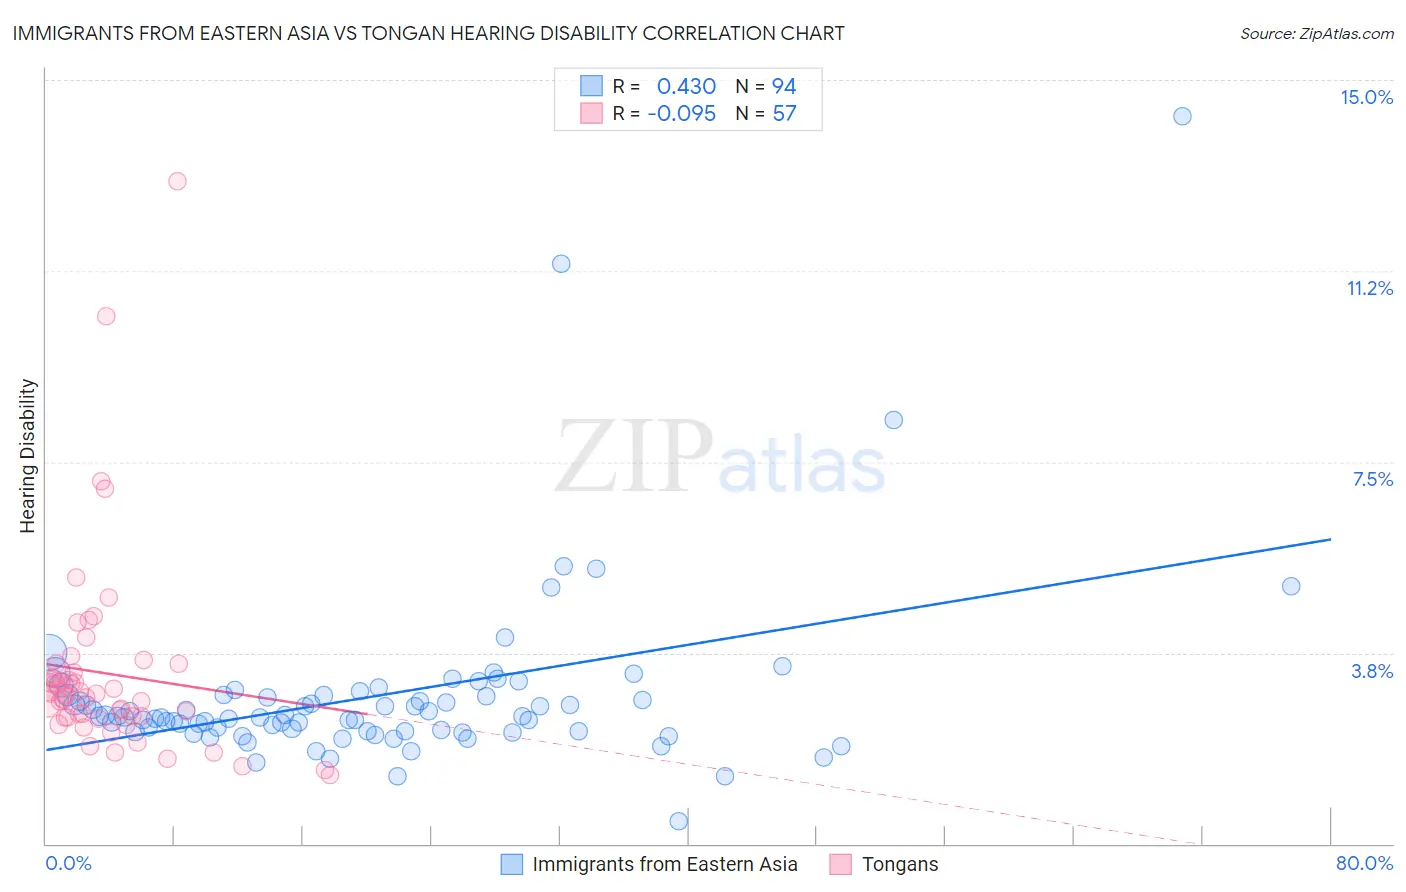
Immigrants from Eastern Asia vs Tongan Hearing Disability Correlation Chart
The statistical analysis conducted on geographies consisting of 499,587,634 people shows a moderate positive correlation between the proportion of Immigrants from Eastern Asia and percentage of population with hearing disability in the United States with a correlation coefficient (R) of 0.430 and weighted average of 2.7%. Similarly, the statistical analysis conducted on geographies consisting of 102,876,442 people shows a slight negative correlation between the proportion of Tongans and percentage of population with hearing disability in the United States with a correlation coefficient (R) of -0.095 and weighted average of 2.9%, a difference of 8.7%.
Hearing Disability Correlation Summary
| Measurement | Immigrants from Eastern Asia | Tongan |
| Minimum | 0.45% | 1.4% |
| Maximum | 14.3% | 13.0% |
| Range | 13.8% | 11.7% |
| Mean | 2.9% | 3.3% |
| Median | 2.5% | 2.9% |
| Interquartile 25% (IQ1) | 2.2% | 2.5% |
| Interquartile 75% (IQ3) | 2.9% | 3.4% |
| Interquartile Range (IQR) | 0.71% | 0.97% |
| Standard Deviation (Sample) | 1.8% | 2.0% |
| Standard Deviation (Population) | 1.8% | 1.9% |
Similar Demographics by Hearing Disability
Demographics Similar to Immigrants from Eastern Asia by Hearing Disability
In terms of hearing disability, the demographic groups most similar to Immigrants from Eastern Asia are Ethiopian (2.7%, a difference of 0.030%), Jamaican (2.7%, a difference of 0.070%), Immigrants from Ethiopia (2.7%, a difference of 0.10%), Immigrants from Nicaragua (2.7%, a difference of 0.12%), and South American (2.7%, a difference of 0.16%).
| Demographics | Rating | Rank | Hearing Disability |
| Immigrants | Dominica | 99.3 /100 | #46 | Exceptional 2.6% |
| Immigrants | Israel | 99.3 /100 | #47 | Exceptional 2.6% |
| Immigrants | Singapore | 99.3 /100 | #48 | Exceptional 2.6% |
| Immigrants | South America | 99.2 /100 | #49 | Exceptional 2.7% |
| Paraguayans | 99.2 /100 | #50 | Exceptional 2.7% |
| Immigrants | Hong Kong | 99.2 /100 | #51 | Exceptional 2.7% |
| Jamaicans | 99.0 /100 | #52 | Exceptional 2.7% |
| Immigrants | Eastern Asia | 99.0 /100 | #53 | Exceptional 2.7% |
| Ethiopians | 99.0 /100 | #54 | Exceptional 2.7% |
| Immigrants | Ethiopia | 99.0 /100 | #55 | Exceptional 2.7% |
| Immigrants | Nicaragua | 99.0 /100 | #56 | Exceptional 2.7% |
| South Americans | 99.0 /100 | #57 | Exceptional 2.7% |
| Immigrants | Peru | 98.6 /100 | #58 | Exceptional 2.7% |
| Immigrants | Eritrea | 98.5 /100 | #59 | Exceptional 2.7% |
| Immigrants | Egypt | 98.5 /100 | #60 | Exceptional 2.7% |
Demographics Similar to Tongans by Hearing Disability
In terms of hearing disability, the demographic groups most similar to Tongans are Brazilian (2.9%, a difference of 0.010%), Immigrants from Congo (2.9%, a difference of 0.030%), Immigrants from Bulgaria (2.9%, a difference of 0.080%), Immigrants from Russia (2.9%, a difference of 0.13%), and Immigrants from Panama (2.9%, a difference of 0.25%).
| Demographics | Rating | Rank | Hearing Disability |
| Immigrants | Jordan | 83.7 /100 | #140 | Excellent 2.9% |
| Sub-Saharan Africans | 83.3 /100 | #141 | Excellent 2.9% |
| Laotians | 81.1 /100 | #142 | Excellent 2.9% |
| Immigrants | Bahamas | 80.9 /100 | #143 | Excellent 2.9% |
| Immigrants | Bulgaria | 79.2 /100 | #144 | Good 2.9% |
| Immigrants | Congo | 78.9 /100 | #145 | Good 2.9% |
| Brazilians | 78.7 /100 | #146 | Good 2.9% |
| Tongans | 78.6 /100 | #147 | Good 2.9% |
| Immigrants | Russia | 77.7 /100 | #148 | Good 2.9% |
| Immigrants | Panama | 76.9 /100 | #149 | Good 2.9% |
| Palestinians | 73.6 /100 | #150 | Good 2.9% |
| Immigrants | France | 73.1 /100 | #151 | Good 2.9% |
| Immigrants | Lithuania | 73.0 /100 | #152 | Good 2.9% |
| Sudanese | 72.1 /100 | #153 | Good 2.9% |
| Immigrants | Lebanon | 71.5 /100 | #154 | Good 2.9% |