Nicaraguan vs Tongan Hearing Disability
COMPARE
Nicaraguan
Tongan
Hearing Disability
Hearing Disability Comparison
Nicaraguans
Tongans
2.7%
HEARING DISABILITY
97.9/ 100
METRIC RATING
69th/ 347
METRIC RANK
2.9%
HEARING DISABILITY
78.6/ 100
METRIC RATING
147th/ 347
METRIC RANK
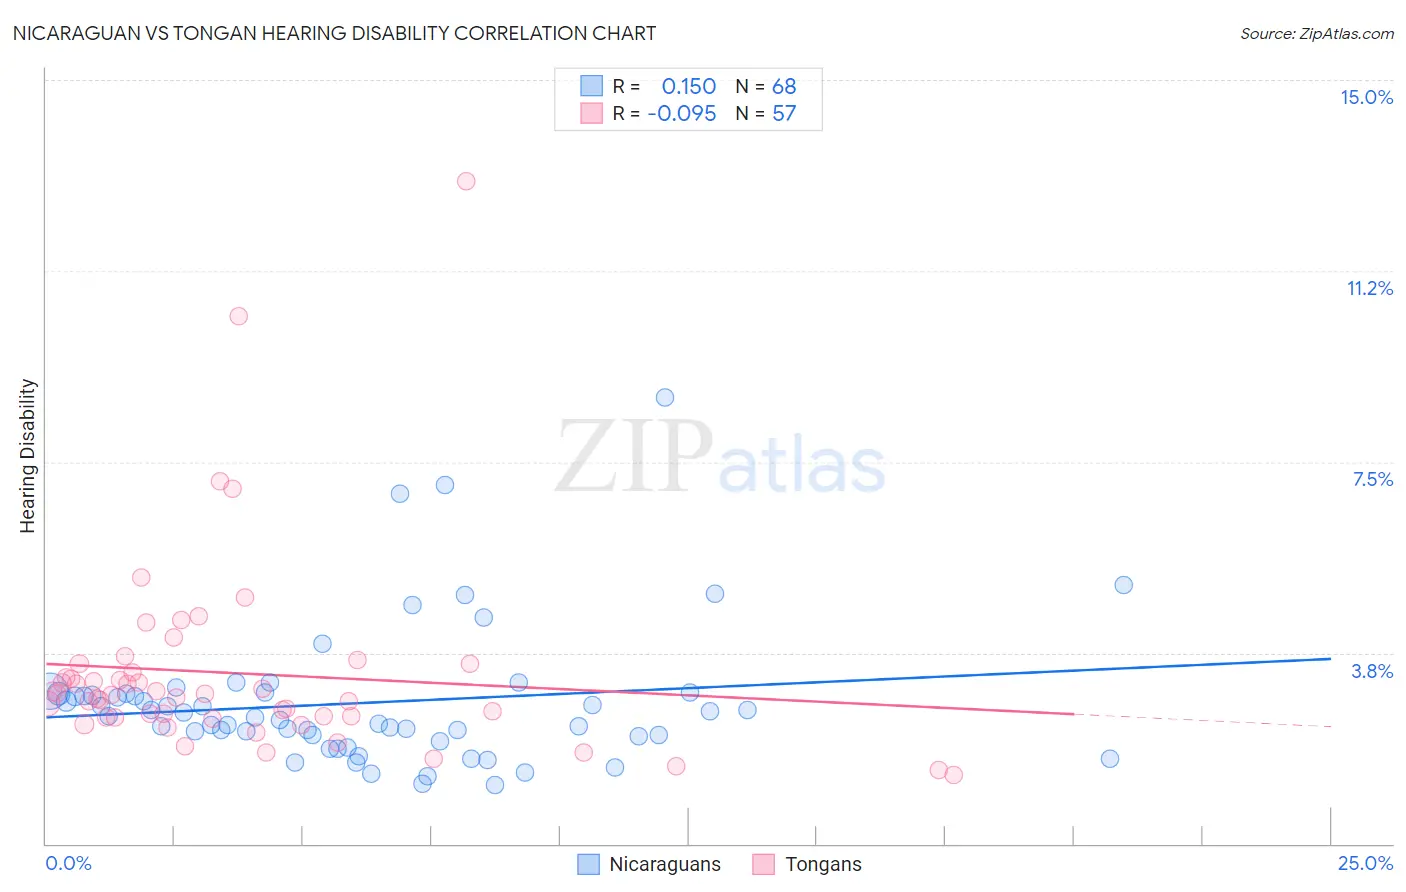
Nicaraguan vs Tongan Hearing Disability Correlation Chart
The statistical analysis conducted on geographies consisting of 285,654,753 people shows a poor positive correlation between the proportion of Nicaraguans and percentage of population with hearing disability in the United States with a correlation coefficient (R) of 0.150 and weighted average of 2.7%. Similarly, the statistical analysis conducted on geographies consisting of 102,876,442 people shows a slight negative correlation between the proportion of Tongans and percentage of population with hearing disability in the United States with a correlation coefficient (R) of -0.095 and weighted average of 2.9%, a difference of 6.6%.
Hearing Disability Correlation Summary
| Measurement | Nicaraguan | Tongan |
| Minimum | 1.2% | 1.4% |
| Maximum | 8.8% | 13.0% |
| Range | 7.6% | 11.7% |
| Mean | 2.8% | 3.3% |
| Median | 2.5% | 2.9% |
| Interquartile 25% (IQ1) | 2.1% | 2.5% |
| Interquartile 75% (IQ3) | 2.9% | 3.4% |
| Interquartile Range (IQR) | 0.81% | 0.97% |
| Standard Deviation (Sample) | 1.4% | 2.0% |
| Standard Deviation (Population) | 1.3% | 1.9% |
Similar Demographics by Hearing Disability
Demographics Similar to Nicaraguans by Hearing Disability
In terms of hearing disability, the demographic groups most similar to Nicaraguans are Immigrants from Africa (2.7%, a difference of 0.040%), Egyptian (2.7%, a difference of 0.17%), Peruvian (2.7%, a difference of 0.23%), Central American (2.7%, a difference of 0.28%), and Afghan (2.7%, a difference of 0.38%).
| Demographics | Rating | Rank | Hearing Disability |
| Immigrants | Colombia | 98.4 /100 | #62 | Exceptional 2.7% |
| Indians (Asian) | 98.4 /100 | #63 | Exceptional 2.7% |
| Immigrants | Sri Lanka | 98.4 /100 | #64 | Exceptional 2.7% |
| Immigrants | Nepal | 98.3 /100 | #65 | Exceptional 2.7% |
| Immigrants | Belize | 98.2 /100 | #66 | Exceptional 2.7% |
| Egyptians | 98.1 /100 | #67 | Exceptional 2.7% |
| Immigrants | Africa | 98.0 /100 | #68 | Exceptional 2.7% |
| Nicaraguans | 97.9 /100 | #69 | Exceptional 2.7% |
| Peruvians | 97.7 /100 | #70 | Exceptional 2.7% |
| Central Americans | 97.7 /100 | #71 | Exceptional 2.7% |
| Afghans | 97.6 /100 | #72 | Exceptional 2.7% |
| Argentineans | 97.5 /100 | #73 | Exceptional 2.7% |
| Immigrants | Korea | 97.5 /100 | #74 | Exceptional 2.7% |
| Immigrants | Saudi Arabia | 97.5 /100 | #75 | Exceptional 2.7% |
| Asians | 97.5 /100 | #76 | Exceptional 2.7% |
Demographics Similar to Tongans by Hearing Disability
In terms of hearing disability, the demographic groups most similar to Tongans are Brazilian (2.9%, a difference of 0.010%), Immigrants from Congo (2.9%, a difference of 0.030%), Immigrants from Bulgaria (2.9%, a difference of 0.080%), Immigrants from Russia (2.9%, a difference of 0.13%), and Immigrants from Panama (2.9%, a difference of 0.25%).
| Demographics | Rating | Rank | Hearing Disability |
| Immigrants | Jordan | 83.7 /100 | #140 | Excellent 2.9% |
| Sub-Saharan Africans | 83.3 /100 | #141 | Excellent 2.9% |
| Laotians | 81.1 /100 | #142 | Excellent 2.9% |
| Immigrants | Bahamas | 80.9 /100 | #143 | Excellent 2.9% |
| Immigrants | Bulgaria | 79.2 /100 | #144 | Good 2.9% |
| Immigrants | Congo | 78.9 /100 | #145 | Good 2.9% |
| Brazilians | 78.7 /100 | #146 | Good 2.9% |
| Tongans | 78.6 /100 | #147 | Good 2.9% |
| Immigrants | Russia | 77.7 /100 | #148 | Good 2.9% |
| Immigrants | Panama | 76.9 /100 | #149 | Good 2.9% |
| Palestinians | 73.6 /100 | #150 | Good 2.9% |
| Immigrants | France | 73.1 /100 | #151 | Good 2.9% |
| Immigrants | Lithuania | 73.0 /100 | #152 | Good 2.9% |
| Sudanese | 72.1 /100 | #153 | Good 2.9% |
| Immigrants | Lebanon | 71.5 /100 | #154 | Good 2.9% |