Immigrants from Sweden vs Tongan Hearing Disability
COMPARE
Immigrants from Sweden
Tongan
Hearing Disability
Hearing Disability Comparison
Immigrants from Sweden
Tongans
3.0%
HEARING DISABILITY
42.4/ 100
METRIC RATING
180th/ 347
METRIC RANK
2.9%
HEARING DISABILITY
78.6/ 100
METRIC RATING
147th/ 347
METRIC RANK
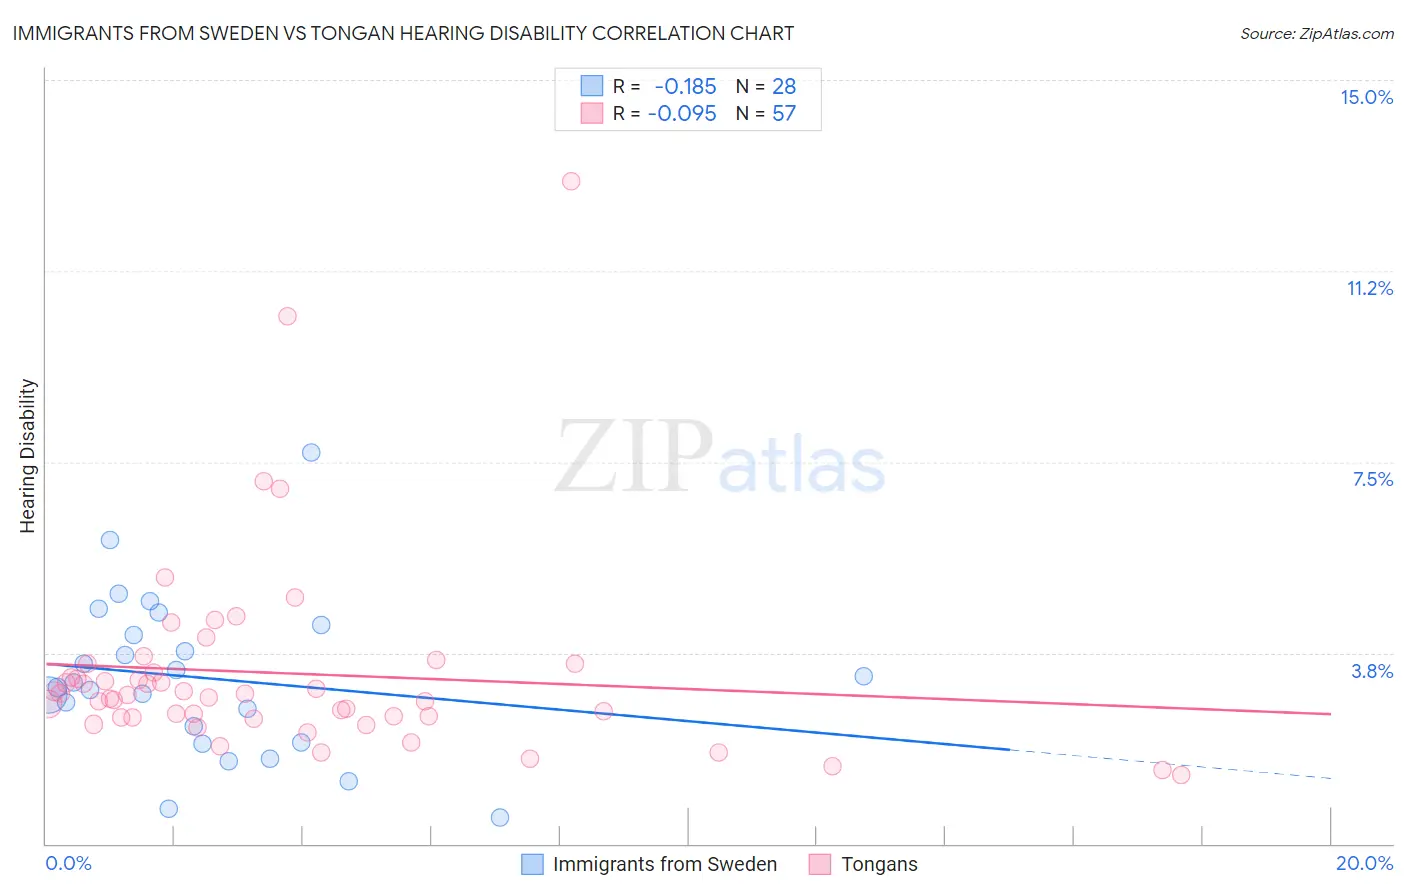
Immigrants from Sweden vs Tongan Hearing Disability Correlation Chart
The statistical analysis conducted on geographies consisting of 164,738,655 people shows a poor negative correlation between the proportion of Immigrants from Sweden and percentage of population with hearing disability in the United States with a correlation coefficient (R) of -0.185 and weighted average of 3.0%. Similarly, the statistical analysis conducted on geographies consisting of 102,876,442 people shows a slight negative correlation between the proportion of Tongans and percentage of population with hearing disability in the United States with a correlation coefficient (R) of -0.095 and weighted average of 2.9%, a difference of 3.9%.
Hearing Disability Correlation Summary
| Measurement | Immigrants from Sweden | Tongan |
| Minimum | 0.51% | 1.4% |
| Maximum | 7.7% | 13.0% |
| Range | 7.2% | 11.7% |
| Mean | 3.3% | 3.3% |
| Median | 3.1% | 2.9% |
| Interquartile 25% (IQ1) | 2.1% | 2.5% |
| Interquartile 75% (IQ3) | 4.2% | 3.4% |
| Interquartile Range (IQR) | 2.1% | 0.97% |
| Standard Deviation (Sample) | 1.6% | 2.0% |
| Standard Deviation (Population) | 1.5% | 1.9% |
Similar Demographics by Hearing Disability
Demographics Similar to Immigrants from Sweden by Hearing Disability
In terms of hearing disability, the demographic groups most similar to Immigrants from Sweden are Immigrants from Moldova (3.0%, a difference of 0.060%), Immigrants from Belgium (3.0%, a difference of 0.090%), Immigrants from Italy (3.0%, a difference of 0.12%), Bulgarian (3.0%, a difference of 0.26%), and Japanese (3.0%, a difference of 0.34%).
| Demographics | Rating | Rank | Hearing Disability |
| Immigrants | Serbia | 51.1 /100 | #173 | Average 3.0% |
| Indonesians | 50.0 /100 | #174 | Average 3.0% |
| Immigrants | Romania | 48.4 /100 | #175 | Average 3.0% |
| Panamanians | 47.0 /100 | #176 | Average 3.0% |
| Immigrants | Philippines | 46.4 /100 | #177 | Average 3.0% |
| Japanese | 46.0 /100 | #178 | Average 3.0% |
| Immigrants | Moldova | 43.1 /100 | #179 | Average 3.0% |
| Immigrants | Sweden | 42.4 /100 | #180 | Average 3.0% |
| Immigrants | Belgium | 41.5 /100 | #181 | Average 3.0% |
| Immigrants | Italy | 41.1 /100 | #182 | Average 3.0% |
| Bulgarians | 39.7 /100 | #183 | Fair 3.0% |
| Immigrants | Ireland | 37.4 /100 | #184 | Fair 3.0% |
| Immigrants | Southern Europe | 35.3 /100 | #185 | Fair 3.0% |
| Immigrants | Mexico | 34.9 /100 | #186 | Fair 3.0% |
| Blacks/African Americans | 34.7 /100 | #187 | Fair 3.0% |
Demographics Similar to Tongans by Hearing Disability
In terms of hearing disability, the demographic groups most similar to Tongans are Brazilian (2.9%, a difference of 0.010%), Immigrants from Congo (2.9%, a difference of 0.030%), Immigrants from Bulgaria (2.9%, a difference of 0.080%), Immigrants from Russia (2.9%, a difference of 0.13%), and Immigrants from Panama (2.9%, a difference of 0.25%).
| Demographics | Rating | Rank | Hearing Disability |
| Immigrants | Jordan | 83.7 /100 | #140 | Excellent 2.9% |
| Sub-Saharan Africans | 83.3 /100 | #141 | Excellent 2.9% |
| Laotians | 81.1 /100 | #142 | Excellent 2.9% |
| Immigrants | Bahamas | 80.9 /100 | #143 | Excellent 2.9% |
| Immigrants | Bulgaria | 79.2 /100 | #144 | Good 2.9% |
| Immigrants | Congo | 78.9 /100 | #145 | Good 2.9% |
| Brazilians | 78.7 /100 | #146 | Good 2.9% |
| Tongans | 78.6 /100 | #147 | Good 2.9% |
| Immigrants | Russia | 77.7 /100 | #148 | Good 2.9% |
| Immigrants | Panama | 76.9 /100 | #149 | Good 2.9% |
| Palestinians | 73.6 /100 | #150 | Good 2.9% |
| Immigrants | France | 73.1 /100 | #151 | Good 2.9% |
| Immigrants | Lithuania | 73.0 /100 | #152 | Good 2.9% |
| Sudanese | 72.1 /100 | #153 | Good 2.9% |
| Immigrants | Lebanon | 71.5 /100 | #154 | Good 2.9% |