Immigrants from West Indies vs Scottish Hearing Disability
COMPARE
Immigrants from West Indies
Scottish
Hearing Disability
Hearing Disability Comparison
Immigrants from West Indies
Scottish
2.5%
HEARING DISABILITY
99.9/ 100
METRIC RATING
16th/ 347
METRIC RANK
3.7%
HEARING DISABILITY
0.0/ 100
METRIC RATING
300th/ 347
METRIC RANK
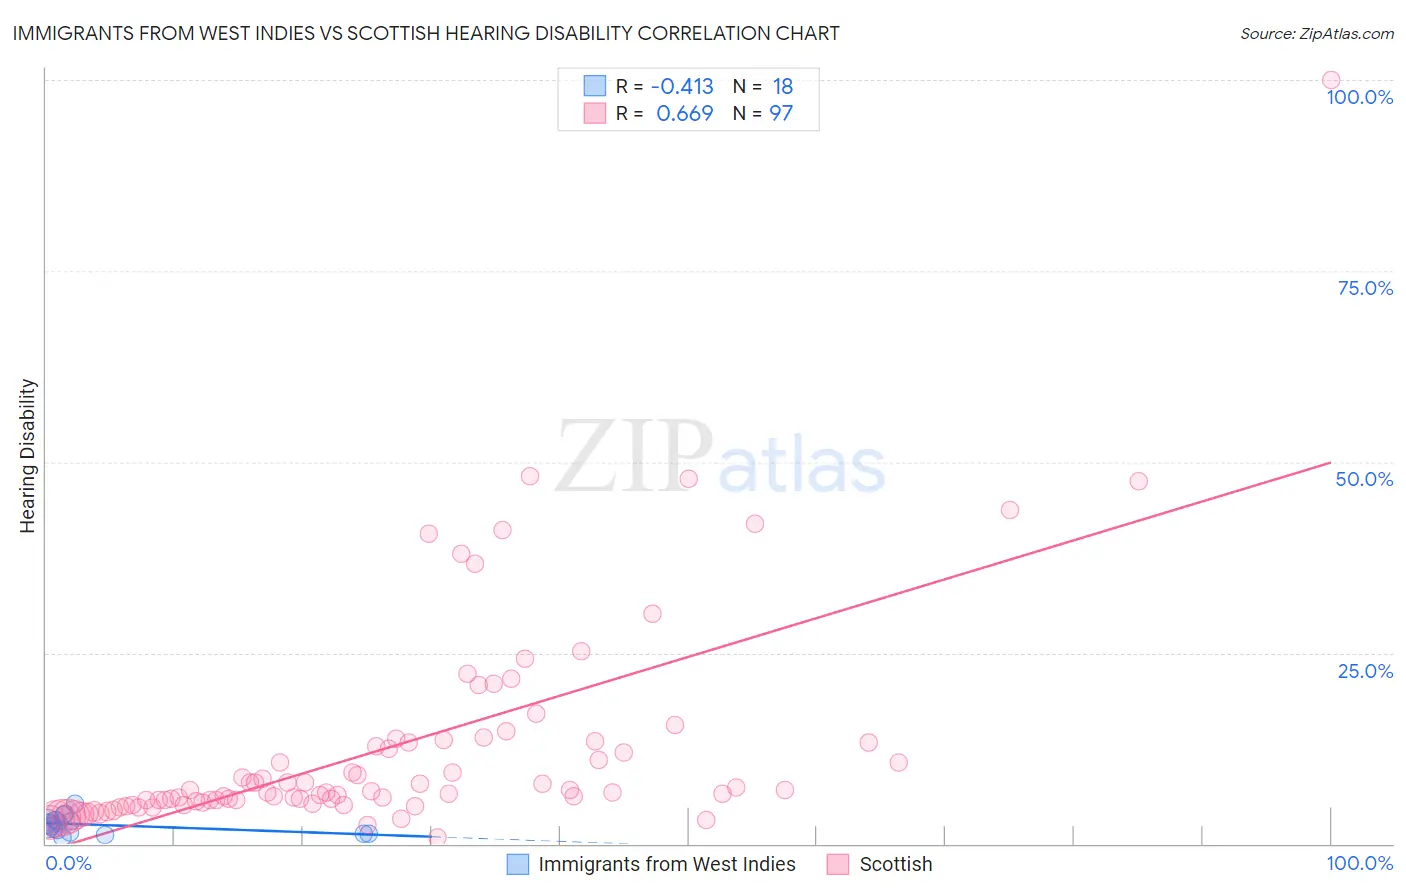
Immigrants from West Indies vs Scottish Hearing Disability Correlation Chart
The statistical analysis conducted on geographies consisting of 72,456,124 people shows a moderate negative correlation between the proportion of Immigrants from West Indies and percentage of population with hearing disability in the United States with a correlation coefficient (R) of -0.413 and weighted average of 2.5%. Similarly, the statistical analysis conducted on geographies consisting of 566,483,062 people shows a significant positive correlation between the proportion of Scottish and percentage of population with hearing disability in the United States with a correlation coefficient (R) of 0.669 and weighted average of 3.7%, a difference of 48.2%.
Hearing Disability Correlation Summary
| Measurement | Immigrants from West Indies | Scottish |
| Minimum | 0.87% | 0.87% |
| Maximum | 5.2% | 100.0% |
| Range | 4.3% | 99.1% |
| Mean | 2.5% | 12.6% |
| Median | 2.6% | 6.8% |
| Interquartile 25% (IQ1) | 1.4% | 5.4% |
| Interquartile 75% (IQ3) | 3.0% | 13.4% |
| Interquartile Range (IQR) | 1.6% | 8.0% |
| Standard Deviation (Sample) | 1.1% | 14.5% |
| Standard Deviation (Population) | 1.1% | 14.4% |
Similar Demographics by Hearing Disability
Demographics Similar to Immigrants from West Indies by Hearing Disability
In terms of hearing disability, the demographic groups most similar to Immigrants from West Indies are Barbadian (2.5%, a difference of 0.15%), Immigrants from India (2.5%, a difference of 0.32%), Ecuadorian (2.5%, a difference of 0.45%), Sierra Leonean (2.5%, a difference of 0.77%), and Trinidadian and Tobagonian (2.5%, a difference of 1.0%).
| Demographics | Rating | Rank | Hearing Disability |
| Immigrants | Dominican Republic | 100.0 /100 | #9 | Exceptional 2.4% |
| Immigrants | Ecuador | 99.9 /100 | #10 | Exceptional 2.5% |
| Immigrants | Trinidad and Tobago | 99.9 /100 | #11 | Exceptional 2.5% |
| Trinidadians and Tobagonians | 99.9 /100 | #12 | Exceptional 2.5% |
| Sierra Leoneans | 99.9 /100 | #13 | Exceptional 2.5% |
| Ecuadorians | 99.9 /100 | #14 | Exceptional 2.5% |
| Barbadians | 99.9 /100 | #15 | Exceptional 2.5% |
| Immigrants | West Indies | 99.9 /100 | #16 | Exceptional 2.5% |
| Immigrants | India | 99.9 /100 | #17 | Exceptional 2.5% |
| Dominicans | 99.8 /100 | #18 | Exceptional 2.5% |
| Thais | 99.8 /100 | #19 | Exceptional 2.5% |
| Immigrants | Bolivia | 99.8 /100 | #20 | Exceptional 2.5% |
| Ghanaians | 99.8 /100 | #21 | Exceptional 2.5% |
| Immigrants | Sierra Leone | 99.8 /100 | #22 | Exceptional 2.6% |
| Immigrants | Nigeria | 99.8 /100 | #23 | Exceptional 2.6% |
Demographics Similar to Scottish by Hearing Disability
In terms of hearing disability, the demographic groups most similar to Scottish are Pennsylvania German (3.7%, a difference of 0.030%), German (3.7%, a difference of 0.060%), Dutch (3.7%, a difference of 0.13%), Menominee (3.7%, a difference of 0.19%), and Celtic (3.7%, a difference of 0.34%).
| Demographics | Rating | Rank | Hearing Disability |
| Norwegians | 0.0 /100 | #293 | Tragic 3.7% |
| Iroquois | 0.0 /100 | #294 | Tragic 3.7% |
| Welsh | 0.0 /100 | #295 | Tragic 3.7% |
| Pima | 0.0 /100 | #296 | Tragic 3.7% |
| Immigrants | Azores | 0.0 /100 | #297 | Tragic 3.7% |
| Celtics | 0.0 /100 | #298 | Tragic 3.7% |
| Germans | 0.0 /100 | #299 | Tragic 3.7% |
| Scottish | 0.0 /100 | #300 | Tragic 3.7% |
| Pennsylvania Germans | 0.0 /100 | #301 | Tragic 3.7% |
| Dutch | 0.0 /100 | #302 | Tragic 3.7% |
| Menominee | 0.0 /100 | #303 | Tragic 3.7% |
| French | 0.0 /100 | #304 | Tragic 3.8% |
| English | 0.0 /100 | #305 | Tragic 3.8% |
| Marshallese | 0.0 /100 | #306 | Tragic 3.8% |
| French Canadians | 0.0 /100 | #307 | Tragic 3.8% |