Immigrants from West Indies vs Colville Hearing Disability
COMPARE
Immigrants from West Indies
Colville
Hearing Disability
Hearing Disability Comparison
Immigrants from West Indies
Colville
2.5%
HEARING DISABILITY
99.9/ 100
METRIC RATING
16th/ 347
METRIC RANK
5.3%
HEARING DISABILITY
0.0/ 100
METRIC RATING
346th/ 347
METRIC RANK
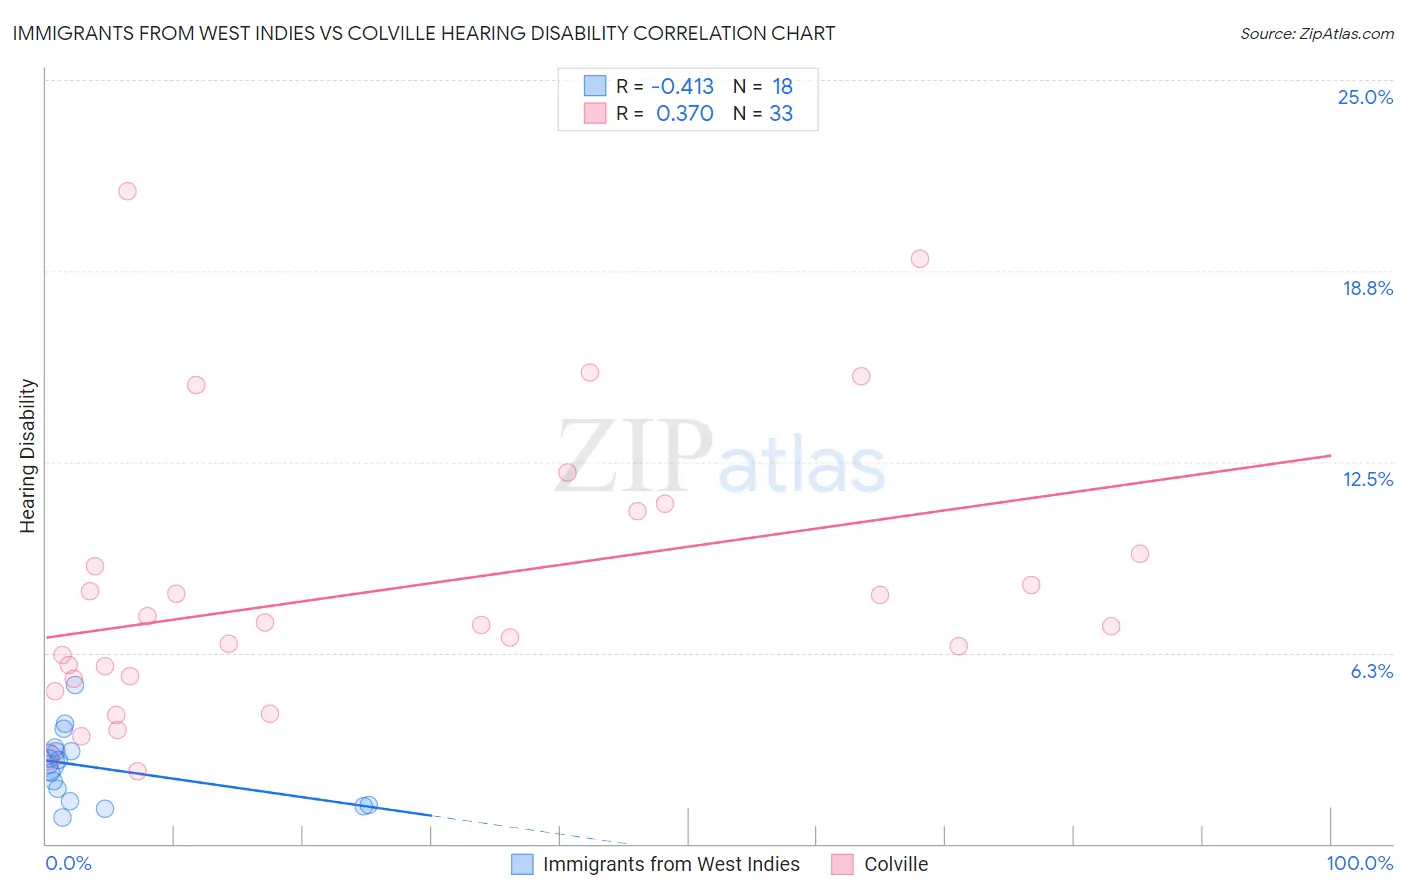
Immigrants from West Indies vs Colville Hearing Disability Correlation Chart
The statistical analysis conducted on geographies consisting of 72,456,124 people shows a moderate negative correlation between the proportion of Immigrants from West Indies and percentage of population with hearing disability in the United States with a correlation coefficient (R) of -0.413 and weighted average of 2.5%. Similarly, the statistical analysis conducted on geographies consisting of 34,687,289 people shows a mild positive correlation between the proportion of Colville and percentage of population with hearing disability in the United States with a correlation coefficient (R) of 0.370 and weighted average of 5.3%, a difference of 112.1%.
Hearing Disability Correlation Summary
| Measurement | Immigrants from West Indies | Colville |
| Minimum | 0.87% | 2.4% |
| Maximum | 5.2% | 21.4% |
| Range | 4.3% | 19.0% |
| Mean | 2.5% | 8.3% |
| Median | 2.6% | 7.2% |
| Interquartile 25% (IQ1) | 1.4% | 5.5% |
| Interquartile 75% (IQ3) | 3.0% | 10.2% |
| Interquartile Range (IQR) | 1.6% | 4.7% |
| Standard Deviation (Sample) | 1.1% | 4.6% |
| Standard Deviation (Population) | 1.1% | 4.5% |
Similar Demographics by Hearing Disability
Demographics Similar to Immigrants from West Indies by Hearing Disability
In terms of hearing disability, the demographic groups most similar to Immigrants from West Indies are Barbadian (2.5%, a difference of 0.15%), Immigrants from India (2.5%, a difference of 0.32%), Ecuadorian (2.5%, a difference of 0.45%), Sierra Leonean (2.5%, a difference of 0.77%), and Trinidadian and Tobagonian (2.5%, a difference of 1.0%).
| Demographics | Rating | Rank | Hearing Disability |
| Immigrants | Dominican Republic | 100.0 /100 | #9 | Exceptional 2.4% |
| Immigrants | Ecuador | 99.9 /100 | #10 | Exceptional 2.5% |
| Immigrants | Trinidad and Tobago | 99.9 /100 | #11 | Exceptional 2.5% |
| Trinidadians and Tobagonians | 99.9 /100 | #12 | Exceptional 2.5% |
| Sierra Leoneans | 99.9 /100 | #13 | Exceptional 2.5% |
| Ecuadorians | 99.9 /100 | #14 | Exceptional 2.5% |
| Barbadians | 99.9 /100 | #15 | Exceptional 2.5% |
| Immigrants | West Indies | 99.9 /100 | #16 | Exceptional 2.5% |
| Immigrants | India | 99.9 /100 | #17 | Exceptional 2.5% |
| Dominicans | 99.8 /100 | #18 | Exceptional 2.5% |
| Thais | 99.8 /100 | #19 | Exceptional 2.5% |
| Immigrants | Bolivia | 99.8 /100 | #20 | Exceptional 2.5% |
| Ghanaians | 99.8 /100 | #21 | Exceptional 2.5% |
| Immigrants | Sierra Leone | 99.8 /100 | #22 | Exceptional 2.6% |
| Immigrants | Nigeria | 99.8 /100 | #23 | Exceptional 2.6% |
Demographics Similar to Colville by Hearing Disability
In terms of hearing disability, the demographic groups most similar to Colville are Alaskan Athabascan (5.3%, a difference of 0.43%), Yup'ik (5.8%, a difference of 9.3%), Tlingit-Haida (4.8%, a difference of 10.4%), Inupiat (4.7%, a difference of 13.4%), and Tsimshian (4.7%, a difference of 13.7%).
| Demographics | Rating | Rank | Hearing Disability |
| Dutch West Indians | 0.0 /100 | #333 | Tragic 4.3% |
| Aleuts | 0.0 /100 | #334 | Tragic 4.3% |
| Kiowa | 0.0 /100 | #335 | Tragic 4.3% |
| Creek | 0.0 /100 | #336 | Tragic 4.4% |
| Chickasaw | 0.0 /100 | #337 | Tragic 4.5% |
| Alaska Natives | 0.0 /100 | #338 | Tragic 4.5% |
| Choctaw | 0.0 /100 | #339 | Tragic 4.5% |
| Pueblo | 0.0 /100 | #340 | Tragic 4.6% |
| Navajo | 0.0 /100 | #341 | Tragic 4.6% |
| Tsimshian | 0.0 /100 | #342 | Tragic 4.7% |
| Inupiat | 0.0 /100 | #343 | Tragic 4.7% |
| Tlingit-Haida | 0.0 /100 | #344 | Tragic 4.8% |
| Alaskan Athabascans | 0.0 /100 | #345 | Tragic 5.3% |
| Colville | 0.0 /100 | #346 | Tragic 5.3% |
| Yup'ik | 0.0 /100 | #347 | Tragic 5.8% |