Immigrants from West Indies vs Tongan Single Mother Households
COMPARE
Immigrants from West Indies
Tongan
Single Mother Households
Single Mother Households Comparison
Immigrants from West Indies
Tongans
7.9%
SINGLE MOTHER HOUSEHOLDS
0.0/ 100
METRIC RATING
298th/ 347
METRIC RANK
5.8%
SINGLE MOTHER HOUSEHOLDS
93.7/ 100
METRIC RATING
120th/ 347
METRIC RANK
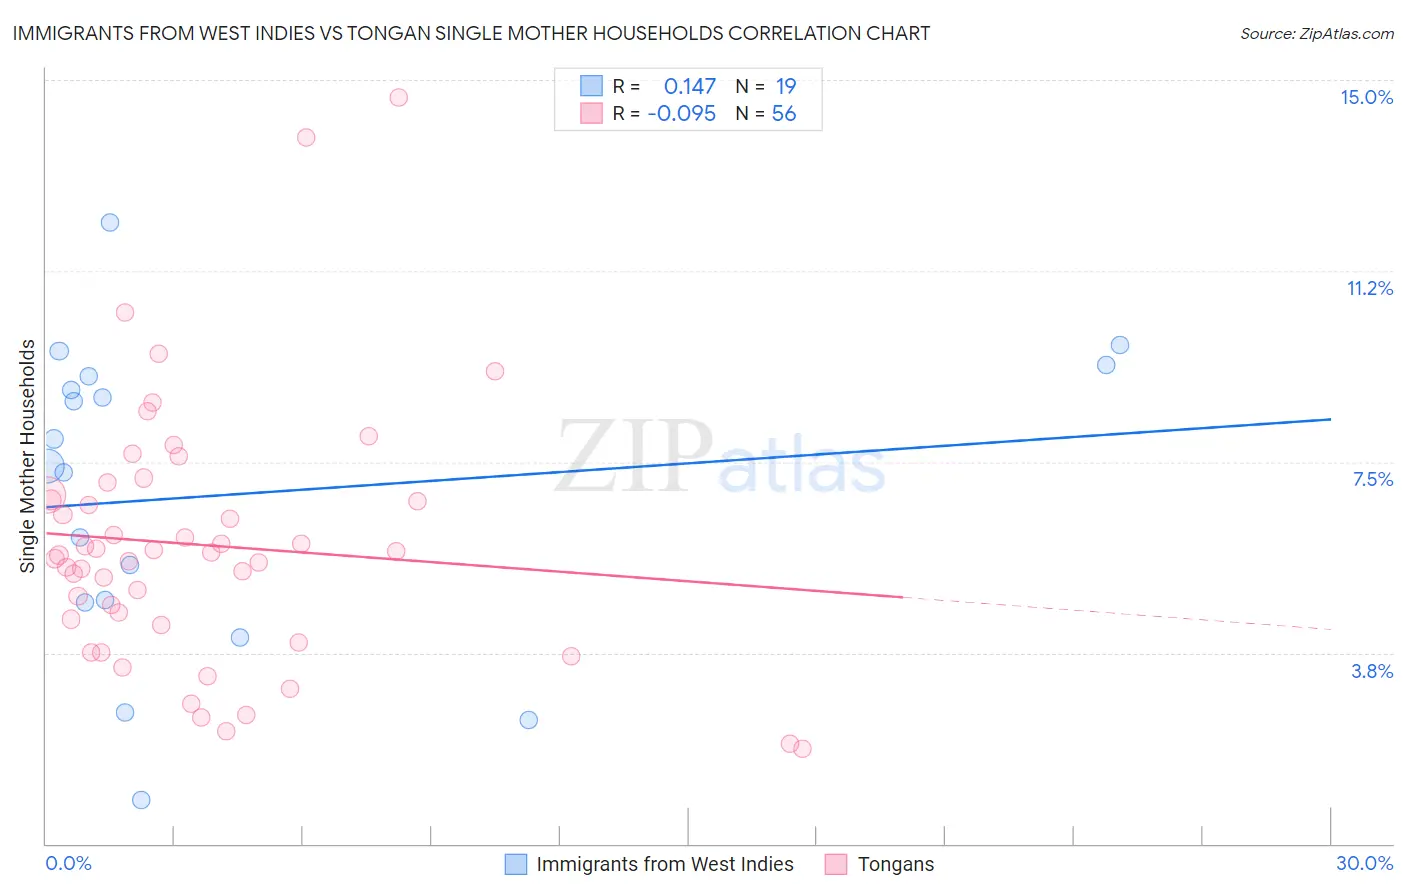
Immigrants from West Indies vs Tongan Single Mother Households Correlation Chart
The statistical analysis conducted on geographies consisting of 72,447,708 people shows a poor positive correlation between the proportion of Immigrants from West Indies and percentage of single mother households in the United States with a correlation coefficient (R) of 0.147 and weighted average of 7.9%. Similarly, the statistical analysis conducted on geographies consisting of 102,827,283 people shows a slight negative correlation between the proportion of Tongans and percentage of single mother households in the United States with a correlation coefficient (R) of -0.095 and weighted average of 5.8%, a difference of 35.5%.
Single Mother Households Correlation Summary
| Measurement | Immigrants from West Indies | Tongan |
| Minimum | 0.85% | 1.9% |
| Maximum | 12.2% | 14.7% |
| Range | 11.4% | 12.8% |
| Mean | 6.9% | 5.9% |
| Median | 7.4% | 5.7% |
| Interquartile 25% (IQ1) | 4.7% | 4.4% |
| Interquartile 75% (IQ3) | 9.2% | 6.8% |
| Interquartile Range (IQR) | 4.4% | 2.5% |
| Standard Deviation (Sample) | 3.0% | 2.5% |
| Standard Deviation (Population) | 2.9% | 2.5% |
Similar Demographics by Single Mother Households
Demographics Similar to Immigrants from West Indies by Single Mother Households
In terms of single mother households, the demographic groups most similar to Immigrants from West Indies are Houma (7.9%, a difference of 0.080%), Hispanic or Latino (7.9%, a difference of 0.11%), Immigrants from Latin America (7.9%, a difference of 0.15%), Barbadian (7.9%, a difference of 0.22%), and Apache (7.9%, a difference of 0.51%).
| Demographics | Rating | Rank | Single Mother Households |
| West Indians | 0.0 /100 | #291 | Tragic 7.8% |
| Ghanaians | 0.0 /100 | #292 | Tragic 7.8% |
| Immigrants | Cameroon | 0.0 /100 | #293 | Tragic 7.9% |
| Apache | 0.0 /100 | #294 | Tragic 7.9% |
| Barbadians | 0.0 /100 | #295 | Tragic 7.9% |
| Immigrants | Latin America | 0.0 /100 | #296 | Tragic 7.9% |
| Hispanics or Latinos | 0.0 /100 | #297 | Tragic 7.9% |
| Immigrants | West Indies | 0.0 /100 | #298 | Tragic 7.9% |
| Houma | 0.0 /100 | #299 | Tragic 7.9% |
| Mexicans | 0.0 /100 | #300 | Tragic 8.0% |
| Chippewa | 0.0 /100 | #301 | Tragic 8.0% |
| Immigrants | Ghana | 0.0 /100 | #302 | Tragic 8.0% |
| Immigrants | Bahamas | 0.0 /100 | #303 | Tragic 8.0% |
| Natives/Alaskans | 0.0 /100 | #304 | Tragic 8.0% |
| Colville | 0.0 /100 | #305 | Tragic 8.0% |
Demographics Similar to Tongans by Single Mother Households
In terms of single mother households, the demographic groups most similar to Tongans are Argentinean (5.8%, a difference of 0.020%), Belgian (5.8%, a difference of 0.10%), Immigrants from Uzbekistan (5.9%, a difference of 0.17%), South African (5.8%, a difference of 0.19%), and Immigrants from Argentina (5.9%, a difference of 0.23%).
| Demographics | Rating | Rank | Single Mother Households |
| Mongolians | 95.3 /100 | #113 | Exceptional 5.8% |
| Dutch | 95.1 /100 | #114 | Exceptional 5.8% |
| Irish | 94.8 /100 | #115 | Exceptional 5.8% |
| Pennsylvania Germans | 94.7 /100 | #116 | Exceptional 5.8% |
| Bolivians | 94.6 /100 | #117 | Exceptional 5.8% |
| Laotians | 94.3 /100 | #118 | Exceptional 5.8% |
| South Africans | 94.1 /100 | #119 | Exceptional 5.8% |
| Tongans | 93.7 /100 | #120 | Exceptional 5.8% |
| Argentineans | 93.7 /100 | #121 | Exceptional 5.8% |
| Belgians | 93.5 /100 | #122 | Exceptional 5.8% |
| Immigrants | Uzbekistan | 93.4 /100 | #123 | Exceptional 5.9% |
| Immigrants | Argentina | 93.2 /100 | #124 | Exceptional 5.9% |
| Slavs | 92.9 /100 | #125 | Exceptional 5.9% |
| Welsh | 92.8 /100 | #126 | Exceptional 5.9% |
| Lebanese | 92.4 /100 | #127 | Exceptional 5.9% |