Immigrants from Ukraine vs Korean Male Disability
COMPARE
Immigrants from Ukraine
Korean
Male Disability
Male Disability Comparison
Immigrants from Ukraine
Koreans
10.9%
MALE DISABILITY
86.8/ 100
METRIC RATING
127th/ 347
METRIC RANK
11.0%
MALE DISABILITY
77.5/ 100
METRIC RATING
146th/ 347
METRIC RANK
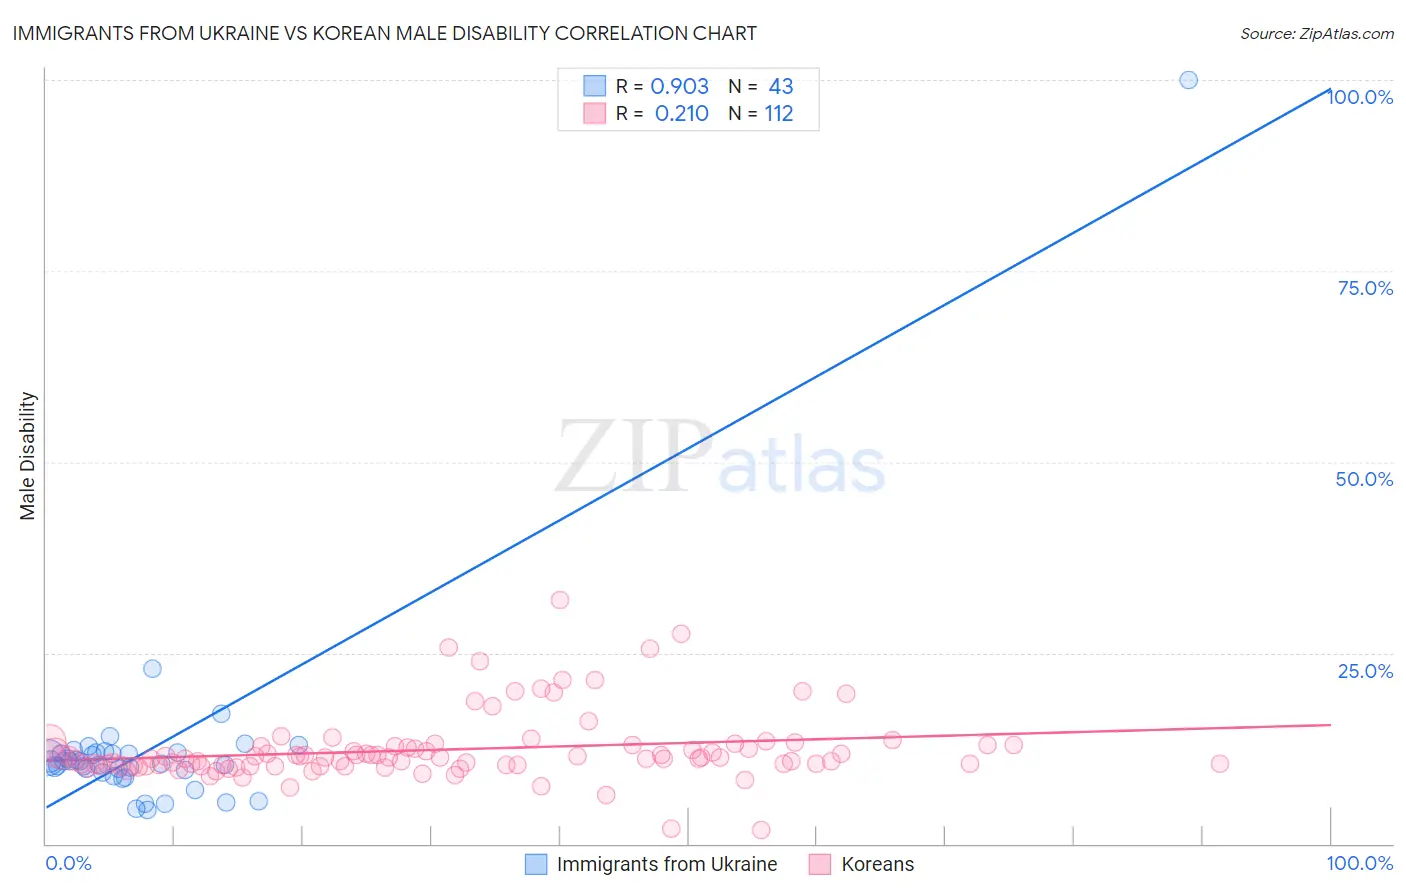
Immigrants from Ukraine vs Korean Male Disability Correlation Chart
The statistical analysis conducted on geographies consisting of 289,679,585 people shows a near-perfect positive correlation between the proportion of Immigrants from Ukraine and percentage of males with a disability in the United States with a correlation coefficient (R) of 0.903 and weighted average of 10.9%. Similarly, the statistical analysis conducted on geographies consisting of 510,777,181 people shows a weak positive correlation between the proportion of Koreans and percentage of males with a disability in the United States with a correlation coefficient (R) of 0.210 and weighted average of 11.0%, a difference of 0.92%.
Male Disability Correlation Summary
| Measurement | Immigrants from Ukraine | Korean |
| Minimum | 4.4% | 1.8% |
| Maximum | 100.0% | 31.9% |
| Range | 95.6% | 30.1% |
| Mean | 12.5% | 12.3% |
| Median | 10.8% | 11.3% |
| Interquartile 25% (IQ1) | 9.3% | 10.3% |
| Interquartile 75% (IQ3) | 11.9% | 12.8% |
| Interquartile Range (IQR) | 2.6% | 2.5% |
| Standard Deviation (Sample) | 14.0% | 4.5% |
| Standard Deviation (Population) | 13.9% | 4.5% |
Demographics Similar to Immigrants from Ukraine and Koreans by Male Disability
In terms of male disability, the demographic groups most similar to Immigrants from Ukraine are Immigrants from Trinidad and Tobago (10.9%, a difference of 0.010%), Immigrants from Latvia (10.9%, a difference of 0.16%), Immigrants from Philippines (10.9%, a difference of 0.16%), Brazilian (10.9%, a difference of 0.16%), and Macedonian (11.0%, a difference of 0.30%). Similarly, the demographic groups most similar to Koreans are Costa Rican (11.0%, a difference of 0.040%), Kenyan (11.0%, a difference of 0.050%), Moroccan (11.0%, a difference of 0.27%), Arab (11.0%, a difference of 0.34%), and Immigrants from Sudan (11.0%, a difference of 0.34%).
| Demographics | Rating | Rank | Male Disability |
| Immigrants | Trinidad and Tobago | 86.9 /100 | #126 | Excellent 10.9% |
| Immigrants | Ukraine | 86.8 /100 | #127 | Excellent 10.9% |
| Immigrants | Latvia | 85.5 /100 | #128 | Excellent 10.9% |
| Immigrants | Philippines | 85.4 /100 | #129 | Excellent 10.9% |
| Brazilians | 85.4 /100 | #130 | Excellent 10.9% |
| Macedonians | 84.2 /100 | #131 | Excellent 11.0% |
| Immigrants | Fiji | 84.0 /100 | #132 | Excellent 11.0% |
| Ugandans | 83.9 /100 | #133 | Excellent 11.0% |
| Bhutanese | 83.4 /100 | #134 | Excellent 11.0% |
| Trinidadians and Tobagonians | 83.3 /100 | #135 | Excellent 11.0% |
| Immigrants | Costa Rica | 82.8 /100 | #136 | Excellent 11.0% |
| Immigrants | Europe | 82.0 /100 | #137 | Excellent 11.0% |
| Nigerians | 81.9 /100 | #138 | Excellent 11.0% |
| South Africans | 81.7 /100 | #139 | Excellent 11.0% |
| Immigrants | Italy | 81.5 /100 | #140 | Excellent 11.0% |
| Arabs | 81.5 /100 | #141 | Excellent 11.0% |
| Immigrants | Sudan | 81.5 /100 | #142 | Excellent 11.0% |
| Moroccans | 80.7 /100 | #143 | Excellent 11.0% |
| Kenyans | 78.1 /100 | #144 | Good 11.0% |
| Costa Ricans | 78.0 /100 | #145 | Good 11.0% |
| Koreans | 77.5 /100 | #146 | Good 11.0% |