Immigrants from Ukraine vs Ottawa Male Disability
COMPARE
Immigrants from Ukraine
Ottawa
Male Disability
Male Disability Comparison
Immigrants from Ukraine
Ottawa
10.9%
MALE DISABILITY
86.8/ 100
METRIC RATING
127th/ 347
METRIC RANK
14.1%
MALE DISABILITY
0.0/ 100
METRIC RATING
325th/ 347
METRIC RANK
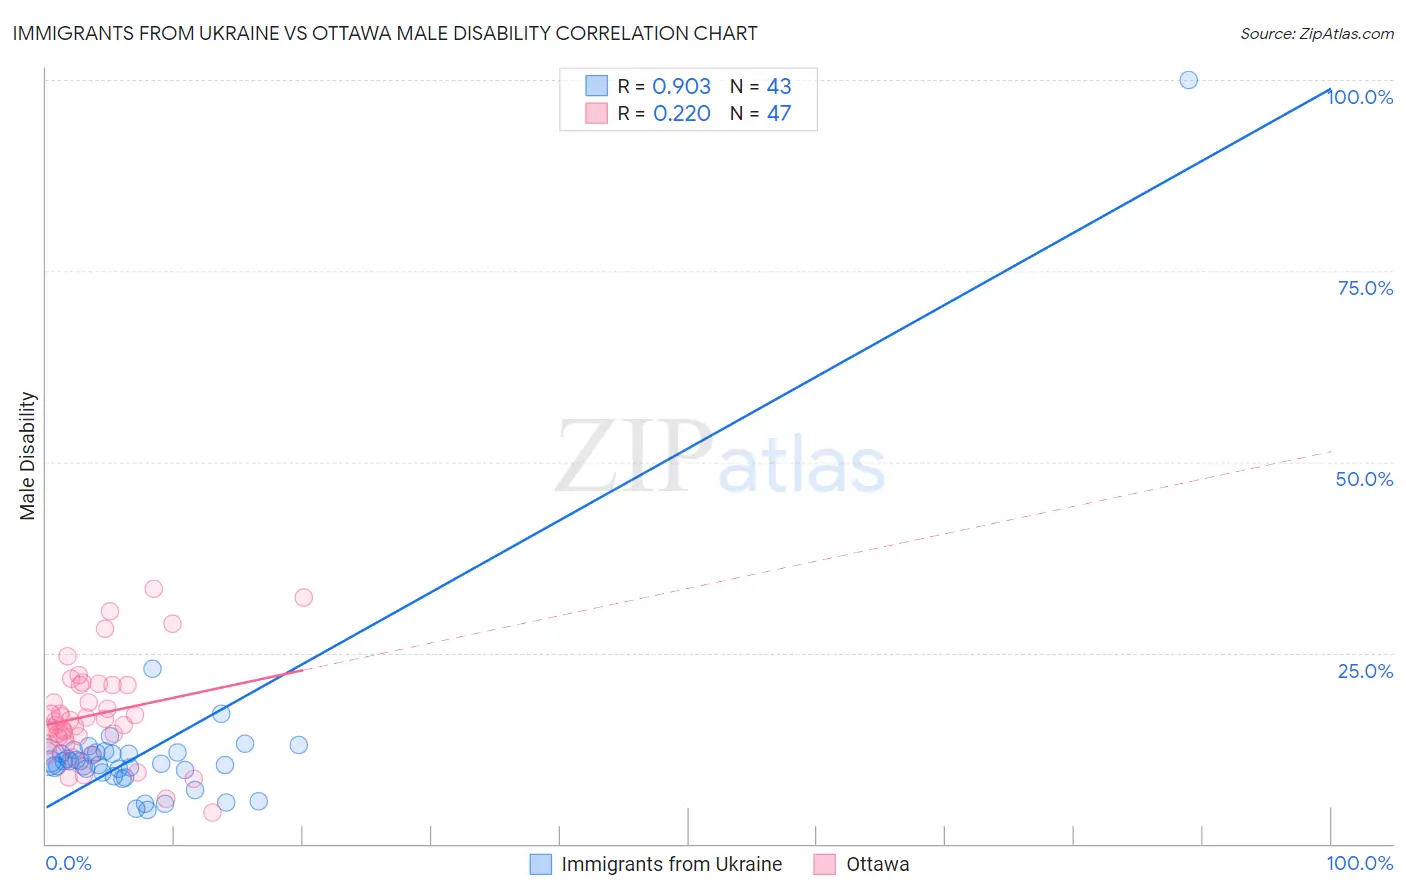
Immigrants from Ukraine vs Ottawa Male Disability Correlation Chart
The statistical analysis conducted on geographies consisting of 289,679,585 people shows a near-perfect positive correlation between the proportion of Immigrants from Ukraine and percentage of males with a disability in the United States with a correlation coefficient (R) of 0.903 and weighted average of 10.9%. Similarly, the statistical analysis conducted on geographies consisting of 49,955,365 people shows a weak positive correlation between the proportion of Ottawa and percentage of males with a disability in the United States with a correlation coefficient (R) of 0.220 and weighted average of 14.1%, a difference of 28.8%.
Male Disability Correlation Summary
| Measurement | Immigrants from Ukraine | Ottawa |
| Minimum | 4.4% | 4.1% |
| Maximum | 100.0% | 33.3% |
| Range | 95.6% | 29.3% |
| Mean | 12.5% | 16.9% |
| Median | 10.8% | 16.0% |
| Interquartile 25% (IQ1) | 9.3% | 13.9% |
| Interquartile 75% (IQ3) | 11.9% | 20.7% |
| Interquartile Range (IQR) | 2.6% | 6.8% |
| Standard Deviation (Sample) | 14.0% | 6.4% |
| Standard Deviation (Population) | 13.9% | 6.3% |
Similar Demographics by Male Disability
Demographics Similar to Immigrants from Ukraine by Male Disability
In terms of male disability, the demographic groups most similar to Immigrants from Ukraine are Immigrants from Trinidad and Tobago (10.9%, a difference of 0.010%), Immigrants from Latvia (10.9%, a difference of 0.16%), Immigrants from Philippines (10.9%, a difference of 0.16%), Brazilian (10.9%, a difference of 0.16%), and South American Indian (10.9%, a difference of 0.17%).
| Demographics | Rating | Rank | Male Disability |
| Immigrants | Africa | 89.4 /100 | #120 | Excellent 10.9% |
| Immigrants | South Eastern Asia | 89.2 /100 | #121 | Excellent 10.9% |
| Immigrants | Ghana | 89.0 /100 | #122 | Excellent 10.9% |
| Immigrants | Czechoslovakia | 88.4 /100 | #123 | Excellent 10.9% |
| South American Indians | 88.1 /100 | #124 | Excellent 10.9% |
| Immigrants | North Macedonia | 88.1 /100 | #125 | Excellent 10.9% |
| Immigrants | Trinidad and Tobago | 86.9 /100 | #126 | Excellent 10.9% |
| Immigrants | Ukraine | 86.8 /100 | #127 | Excellent 10.9% |
| Immigrants | Latvia | 85.5 /100 | #128 | Excellent 10.9% |
| Immigrants | Philippines | 85.4 /100 | #129 | Excellent 10.9% |
| Brazilians | 85.4 /100 | #130 | Excellent 10.9% |
| Macedonians | 84.2 /100 | #131 | Excellent 11.0% |
| Immigrants | Fiji | 84.0 /100 | #132 | Excellent 11.0% |
| Ugandans | 83.9 /100 | #133 | Excellent 11.0% |
| Bhutanese | 83.4 /100 | #134 | Excellent 11.0% |
Demographics Similar to Ottawa by Male Disability
In terms of male disability, the demographic groups most similar to Ottawa are Comanche (14.1%, a difference of 0.11%), Osage (14.0%, a difference of 0.44%), Apache (14.0%, a difference of 0.51%), Native/Alaskan (14.2%, a difference of 0.94%), and Potawatomi (14.2%, a difference of 1.1%).
| Demographics | Rating | Rank | Male Disability |
| Cree | 0.0 /100 | #318 | Tragic 13.7% |
| Americans | 0.0 /100 | #319 | Tragic 13.8% |
| Tlingit-Haida | 0.0 /100 | #320 | Tragic 13.8% |
| Shoshone | 0.0 /100 | #321 | Tragic 13.8% |
| Apache | 0.0 /100 | #322 | Tragic 14.0% |
| Osage | 0.0 /100 | #323 | Tragic 14.0% |
| Comanche | 0.0 /100 | #324 | Tragic 14.1% |
| Ottawa | 0.0 /100 | #325 | Tragic 14.1% |
| Natives/Alaskans | 0.0 /100 | #326 | Tragic 14.2% |
| Potawatomi | 0.0 /100 | #327 | Tragic 14.2% |
| Chippewa | 0.0 /100 | #328 | Tragic 14.3% |
| Cajuns | 0.0 /100 | #329 | Tragic 14.4% |
| Navajo | 0.0 /100 | #330 | Tragic 14.4% |
| Tohono O'odham | 0.0 /100 | #331 | Tragic 14.6% |
| Seminole | 0.0 /100 | #332 | Tragic 14.7% |