Immigrants from Ukraine vs Korean Single Mother Households
COMPARE
Immigrants from Ukraine
Korean
Single Mother Households
Single Mother Households Comparison
Immigrants from Ukraine
Koreans
5.8%
SINGLE MOTHER HOUSEHOLDS
95.9/ 100
METRIC RATING
106th/ 347
METRIC RANK
6.0%
SINGLE MOTHER HOUSEHOLDS
84.4/ 100
METRIC RATING
144th/ 347
METRIC RANK
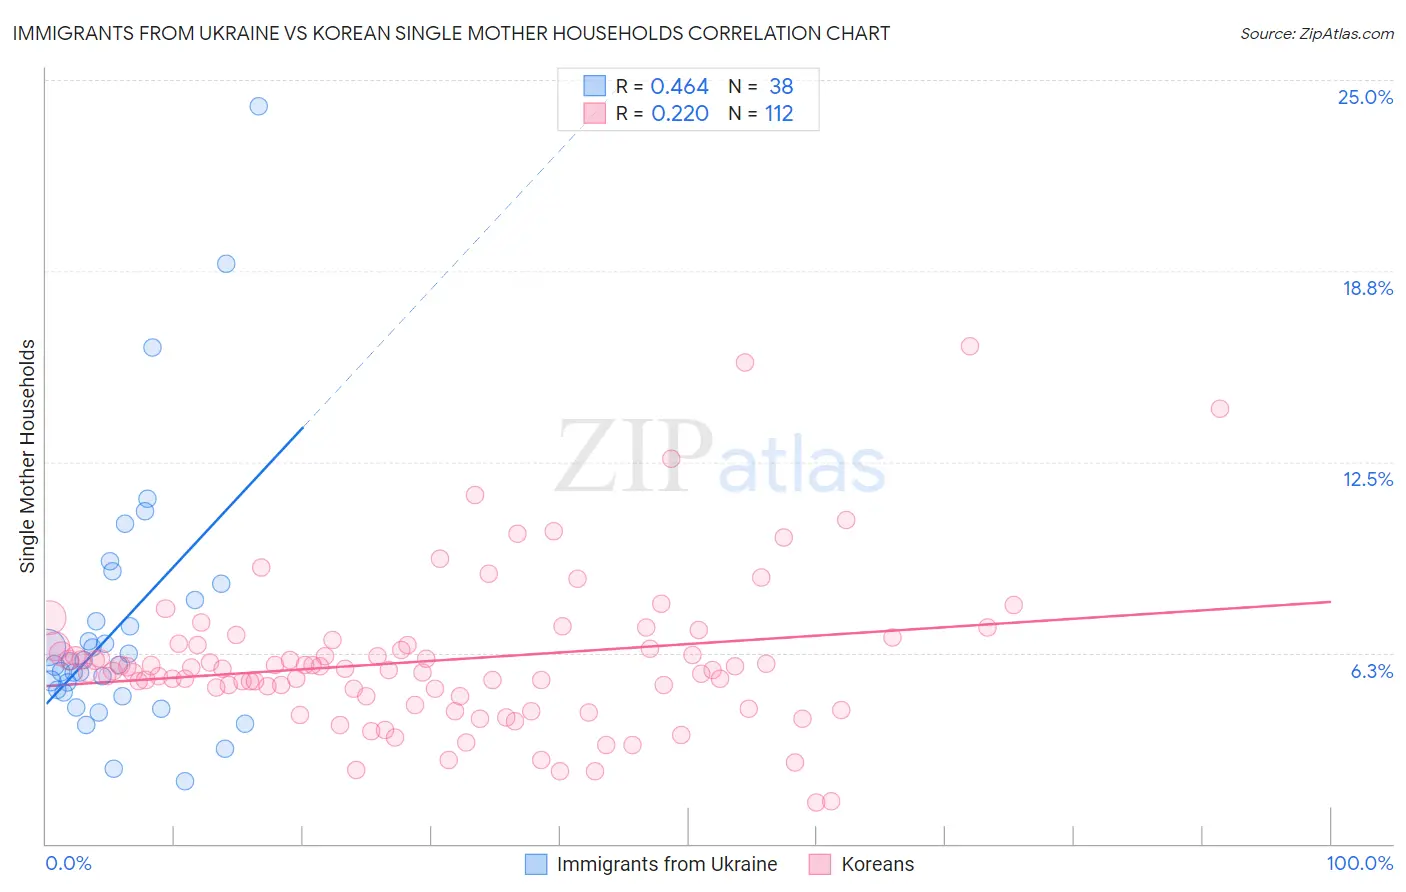
Immigrants from Ukraine vs Korean Single Mother Households Correlation Chart
The statistical analysis conducted on geographies consisting of 289,094,970 people shows a moderate positive correlation between the proportion of Immigrants from Ukraine and percentage of single mother households in the United States with a correlation coefficient (R) of 0.464 and weighted average of 5.8%. Similarly, the statistical analysis conducted on geographies consisting of 508,458,058 people shows a weak positive correlation between the proportion of Koreans and percentage of single mother households in the United States with a correlation coefficient (R) of 0.220 and weighted average of 6.0%, a difference of 4.4%.
Single Mother Households Correlation Summary
| Measurement | Immigrants from Ukraine | Korean |
| Minimum | 2.1% | 1.4% |
| Maximum | 24.1% | 16.3% |
| Range | 22.1% | 14.9% |
| Mean | 7.2% | 6.0% |
| Median | 5.9% | 5.7% |
| Interquartile 25% (IQ1) | 4.9% | 4.8% |
| Interquartile 75% (IQ3) | 8.0% | 6.5% |
| Interquartile Range (IQR) | 3.1% | 1.7% |
| Standard Deviation (Sample) | 4.4% | 2.5% |
| Standard Deviation (Population) | 4.3% | 2.5% |
Similar Demographics by Single Mother Households
Demographics Similar to Immigrants from Ukraine by Single Mother Households
In terms of single mother households, the demographic groups most similar to Immigrants from Ukraine are Taiwanese (5.8%, a difference of 0.10%), Paraguayan (5.8%, a difference of 0.11%), Immigrants from Italy (5.8%, a difference of 0.12%), Scottish (5.8%, a difference of 0.18%), and Northern European (5.8%, a difference of 0.18%).
| Demographics | Rating | Rank | Single Mother Households |
| Immigrants | Poland | 96.3 /100 | #99 | Exceptional 5.8% |
| Scandinavians | 96.2 /100 | #100 | Exceptional 5.8% |
| Germans | 96.2 /100 | #101 | Exceptional 5.8% |
| English | 96.2 /100 | #102 | Exceptional 5.8% |
| Scottish | 96.2 /100 | #103 | Exceptional 5.8% |
| Northern Europeans | 96.2 /100 | #104 | Exceptional 5.8% |
| Taiwanese | 96.1 /100 | #105 | Exceptional 5.8% |
| Immigrants | Ukraine | 95.9 /100 | #106 | Exceptional 5.8% |
| Paraguayans | 95.8 /100 | #107 | Exceptional 5.8% |
| Immigrants | Italy | 95.8 /100 | #108 | Exceptional 5.8% |
| Immigrants | Western Europe | 95.7 /100 | #109 | Exceptional 5.8% |
| British | 95.5 /100 | #110 | Exceptional 5.8% |
| Immigrants | England | 95.5 /100 | #111 | Exceptional 5.8% |
| Immigrants | Kuwait | 95.4 /100 | #112 | Exceptional 5.8% |
| Mongolians | 95.3 /100 | #113 | Exceptional 5.8% |
Demographics Similar to Koreans by Single Mother Households
In terms of single mother households, the demographic groups most similar to Koreans are Arab (6.0%, a difference of 0.090%), Immigrants from Iraq (6.0%, a difference of 0.10%), Immigrants from Egypt (6.0%, a difference of 0.14%), Tsimshian (6.0%, a difference of 0.19%), and French (6.0%, a difference of 0.29%).
| Demographics | Rating | Rank | Single Mother Households |
| Immigrants | Pakistan | 88.4 /100 | #137 | Excellent 6.0% |
| Icelanders | 86.9 /100 | #138 | Excellent 6.0% |
| Syrians | 86.0 /100 | #139 | Excellent 6.0% |
| French | 85.7 /100 | #140 | Excellent 6.0% |
| Tsimshian | 85.2 /100 | #141 | Excellent 6.0% |
| Immigrants | Egypt | 85.0 /100 | #142 | Excellent 6.0% |
| Immigrants | Iraq | 84.8 /100 | #143 | Excellent 6.0% |
| Koreans | 84.4 /100 | #144 | Excellent 6.0% |
| Arabs | 84.0 /100 | #145 | Excellent 6.0% |
| French Canadians | 82.6 /100 | #146 | Excellent 6.0% |
| Immigrants | Jordan | 82.3 /100 | #147 | Excellent 6.0% |
| Scotch-Irish | 82.0 /100 | #148 | Excellent 6.0% |
| Immigrants | Albania | 81.5 /100 | #149 | Excellent 6.1% |
| Zimbabweans | 80.7 /100 | #150 | Excellent 6.1% |
| Immigrants | Southern Europe | 80.5 /100 | #151 | Excellent 6.1% |