Immigrants from Ukraine vs Korean In Labor Force | Age 45-54
COMPARE
Immigrants from Ukraine
Korean
In Labor Force | Age 45-54
In Labor Force | Age 45-54 Comparison
Immigrants from Ukraine
Koreans
83.0%
IN LABOR FORCE | AGE 45-54
82.9/ 100
METRIC RATING
132nd/ 347
METRIC RANK
82.9%
IN LABOR FORCE | AGE 45-54
71.9/ 100
METRIC RATING
151st/ 347
METRIC RANK
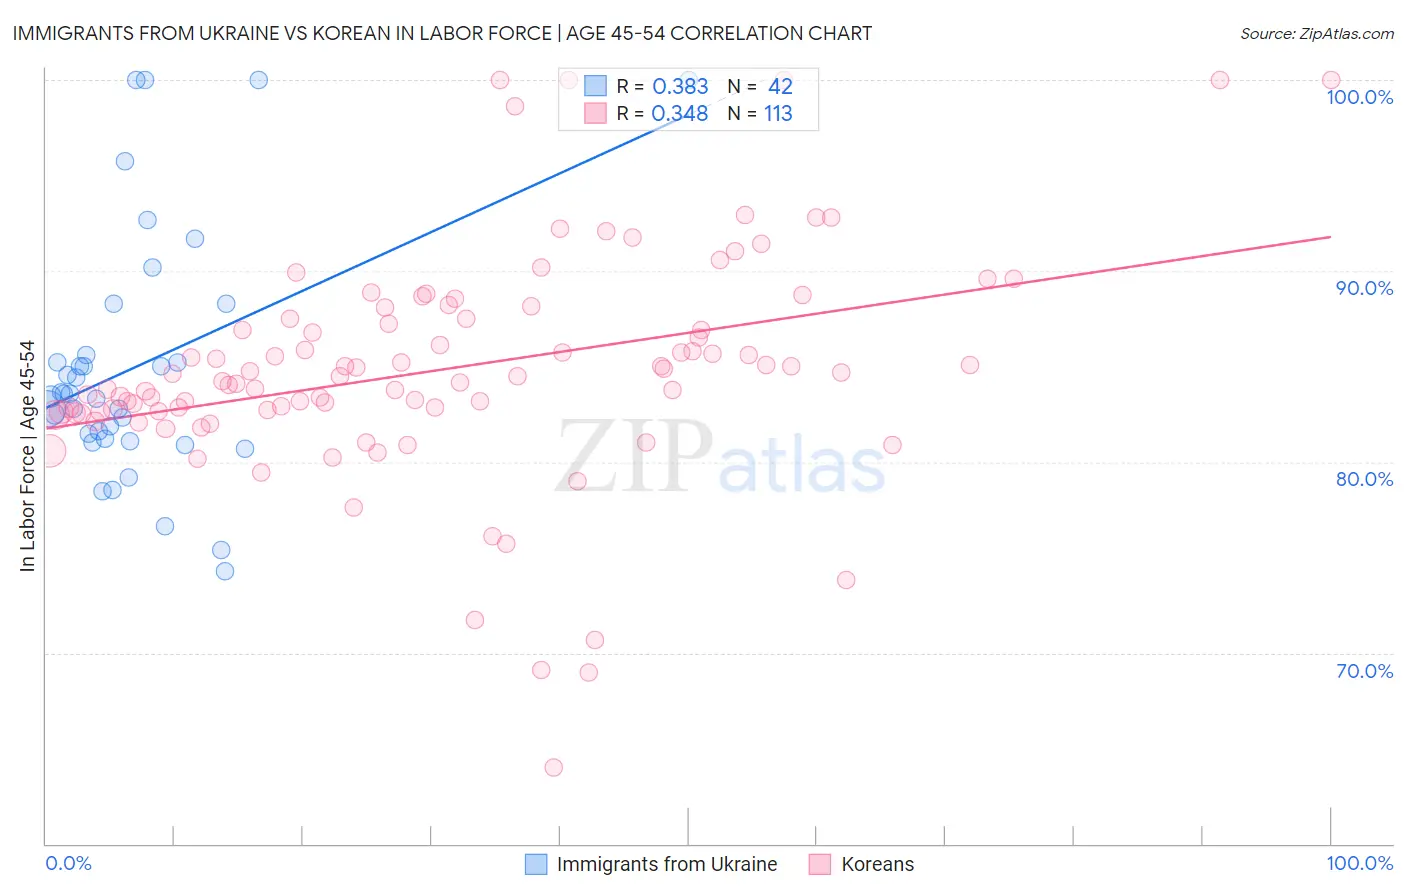
Immigrants from Ukraine vs Korean In Labor Force | Age 45-54 Correlation Chart
The statistical analysis conducted on geographies consisting of 289,631,932 people shows a mild positive correlation between the proportion of Immigrants from Ukraine and labor force participation rate among population between the ages 45 and 54 in the United States with a correlation coefficient (R) of 0.383 and weighted average of 83.0%. Similarly, the statistical analysis conducted on geographies consisting of 510,364,198 people shows a mild positive correlation between the proportion of Koreans and labor force participation rate among population between the ages 45 and 54 in the United States with a correlation coefficient (R) of 0.348 and weighted average of 82.9%, a difference of 0.14%.
In Labor Force | Age 45-54 Correlation Summary
| Measurement | Immigrants from Ukraine | Korean |
| Minimum | 74.3% | 64.0% |
| Maximum | 100.0% | 100.0% |
| Range | 25.7% | 36.0% |
| Mean | 85.0% | 84.8% |
| Median | 83.5% | 84.5% |
| Interquartile 25% (IQ1) | 81.2% | 82.6% |
| Interquartile 75% (IQ3) | 85.6% | 87.5% |
| Interquartile Range (IQR) | 4.3% | 4.9% |
| Standard Deviation (Sample) | 6.5% | 6.0% |
| Standard Deviation (Population) | 6.4% | 6.0% |
Demographics Similar to Immigrants from Ukraine and Koreans by In Labor Force | Age 45-54
In terms of in labor force | age 45-54, the demographic groups most similar to Immigrants from Ukraine are Liberian (83.0%, a difference of 0.0%), Finnish (83.1%, a difference of 0.010%), Sudanese (83.0%, a difference of 0.010%), Austrian (83.0%, a difference of 0.030%), and Immigrants from Kazakhstan (83.0%, a difference of 0.030%). Similarly, the demographic groups most similar to Koreans are Immigrants from Sweden (82.9%, a difference of 0.010%), Immigrants from Netherlands (82.9%, a difference of 0.010%), Immigrants from Nigeria (83.0%, a difference of 0.020%), Czechoslovakian (83.0%, a difference of 0.030%), and Romanian (83.0%, a difference of 0.040%).
| Demographics | Rating | Rank | In Labor Force | Age 45-54 |
| Finns | 83.3 /100 | #131 | Excellent 83.1% |
| Immigrants | Ukraine | 82.9 /100 | #132 | Excellent 83.0% |
| Liberians | 82.7 /100 | #133 | Excellent 83.0% |
| Sudanese | 82.0 /100 | #134 | Excellent 83.0% |
| Austrians | 81.3 /100 | #135 | Excellent 83.0% |
| Immigrants | Kazakhstan | 81.0 /100 | #136 | Excellent 83.0% |
| Immigrants | Spain | 80.4 /100 | #137 | Excellent 83.0% |
| Ghanaians | 79.5 /100 | #138 | Good 83.0% |
| Scandinavians | 78.5 /100 | #139 | Good 83.0% |
| Yugoslavians | 78.3 /100 | #140 | Good 83.0% |
| Immigrants | Haiti | 77.9 /100 | #141 | Good 83.0% |
| Immigrants | Scotland | 77.8 /100 | #142 | Good 83.0% |
| Okinawans | 77.0 /100 | #143 | Good 83.0% |
| Soviet Union | 76.8 /100 | #144 | Good 83.0% |
| Romanians | 75.4 /100 | #145 | Good 83.0% |
| Immigrants | France | 75.3 /100 | #146 | Good 83.0% |
| Czechoslovakians | 74.8 /100 | #147 | Good 83.0% |
| Immigrants | Nigeria | 74.1 /100 | #148 | Good 83.0% |
| Immigrants | Sweden | 73.3 /100 | #149 | Good 82.9% |
| Immigrants | Netherlands | 72.6 /100 | #150 | Good 82.9% |
| Koreans | 71.9 /100 | #151 | Good 82.9% |