Senegalese vs Korean Male Disability
COMPARE
Senegalese
Korean
Male Disability
Male Disability Comparison
Senegalese
Koreans
11.4%
MALE DISABILITY
23.2/ 100
METRIC RATING
191st/ 347
METRIC RANK
11.0%
MALE DISABILITY
77.5/ 100
METRIC RATING
146th/ 347
METRIC RANK
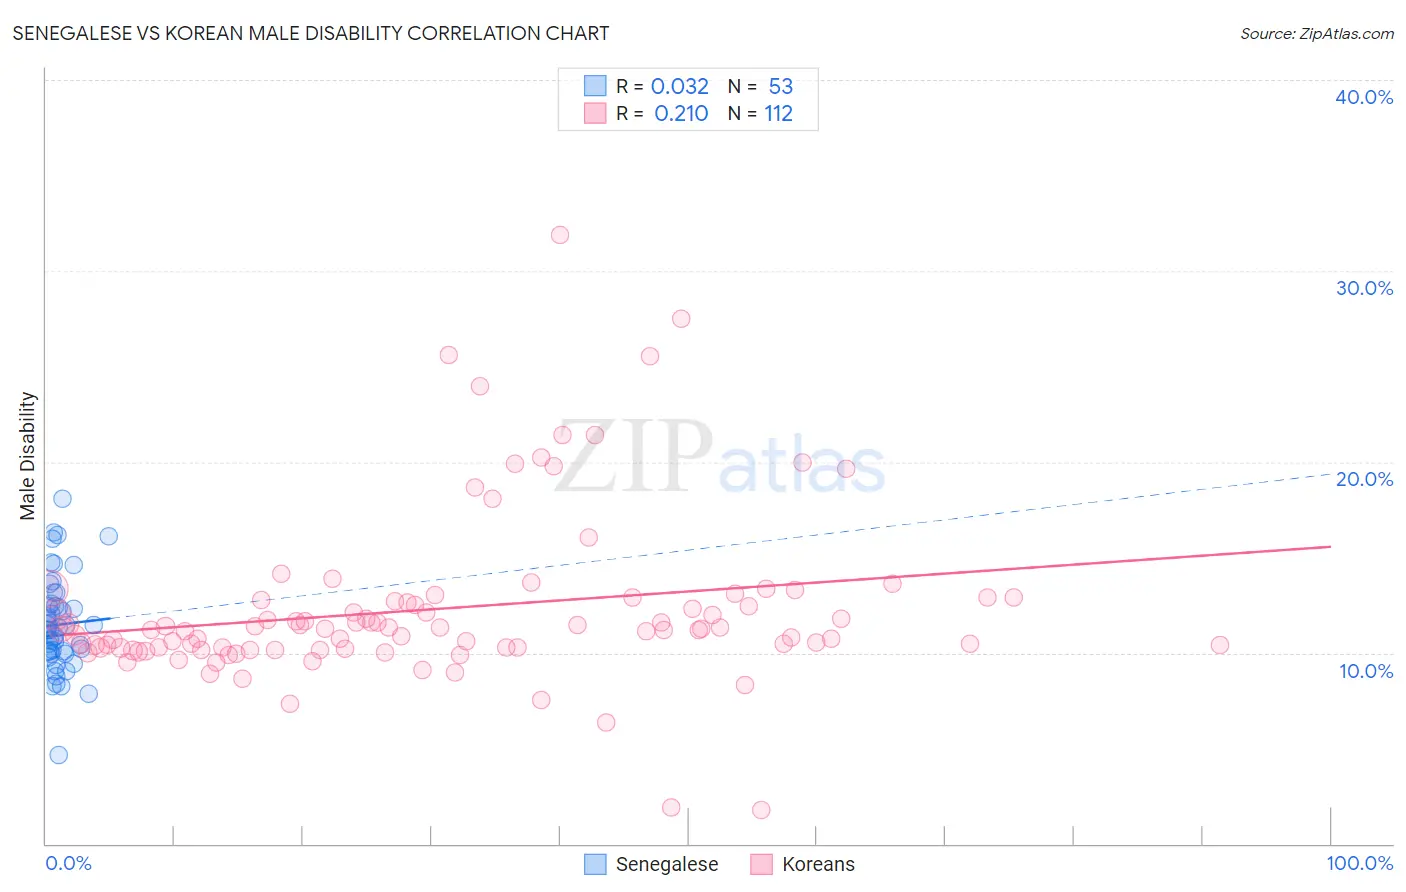
Senegalese vs Korean Male Disability Correlation Chart
The statistical analysis conducted on geographies consisting of 78,137,196 people shows no correlation between the proportion of Senegalese and percentage of males with a disability in the United States with a correlation coefficient (R) of 0.032 and weighted average of 11.4%. Similarly, the statistical analysis conducted on geographies consisting of 510,777,181 people shows a weak positive correlation between the proportion of Koreans and percentage of males with a disability in the United States with a correlation coefficient (R) of 0.210 and weighted average of 11.0%, a difference of 3.4%.
Male Disability Correlation Summary
| Measurement | Senegalese | Korean |
| Minimum | 4.6% | 1.8% |
| Maximum | 18.0% | 31.9% |
| Range | 13.4% | 30.1% |
| Mean | 11.5% | 12.3% |
| Median | 11.2% | 11.3% |
| Interquartile 25% (IQ1) | 10.0% | 10.3% |
| Interquartile 75% (IQ3) | 12.5% | 12.8% |
| Interquartile Range (IQR) | 2.5% | 2.5% |
| Standard Deviation (Sample) | 2.5% | 4.5% |
| Standard Deviation (Population) | 2.5% | 4.5% |
Similar Demographics by Male Disability
Demographics Similar to Senegalese by Male Disability
In terms of male disability, the demographic groups most similar to Senegalese are Assyrian/Chaldean/Syriac (11.4%, a difference of 0.0%), Greek (11.4%, a difference of 0.080%), Immigrants from Bosnia and Herzegovina (11.4%, a difference of 0.16%), Belizean (11.4%, a difference of 0.16%), and Immigrants from Oceania (11.4%, a difference of 0.19%).
| Demographics | Rating | Rank | Male Disability |
| Iraqis | 30.5 /100 | #184 | Fair 11.3% |
| Pakistanis | 30.3 /100 | #185 | Fair 11.3% |
| Immigrants | Zaire | 27.6 /100 | #186 | Fair 11.4% |
| Immigrants | Austria | 27.3 /100 | #187 | Fair 11.4% |
| Estonians | 26.8 /100 | #188 | Fair 11.4% |
| Immigrants | Netherlands | 25.9 /100 | #189 | Fair 11.4% |
| Immigrants | Bosnia and Herzegovina | 25.4 /100 | #190 | Fair 11.4% |
| Senegalese | 23.2 /100 | #191 | Fair 11.4% |
| Assyrians/Chaldeans/Syriacs | 23.2 /100 | #192 | Fair 11.4% |
| Greeks | 22.2 /100 | #193 | Fair 11.4% |
| Belizeans | 21.2 /100 | #194 | Fair 11.4% |
| Immigrants | Oceania | 20.9 /100 | #195 | Fair 11.4% |
| West Indians | 18.4 /100 | #196 | Poor 11.4% |
| Somalis | 18.2 /100 | #197 | Poor 11.4% |
| Immigrants | Jamaica | 16.3 /100 | #198 | Poor 11.5% |
Demographics Similar to Koreans by Male Disability
In terms of male disability, the demographic groups most similar to Koreans are Immigrants from Croatia (11.0%, a difference of 0.020%), Sudanese (11.0%, a difference of 0.030%), Costa Rican (11.0%, a difference of 0.040%), Kenyan (11.0%, a difference of 0.050%), and Immigrants from Denmark (11.0%, a difference of 0.090%).
| Demographics | Rating | Rank | Male Disability |
| South Africans | 81.7 /100 | #139 | Excellent 11.0% |
| Immigrants | Italy | 81.5 /100 | #140 | Excellent 11.0% |
| Arabs | 81.5 /100 | #141 | Excellent 11.0% |
| Immigrants | Sudan | 81.5 /100 | #142 | Excellent 11.0% |
| Moroccans | 80.7 /100 | #143 | Excellent 11.0% |
| Kenyans | 78.1 /100 | #144 | Good 11.0% |
| Costa Ricans | 78.0 /100 | #145 | Good 11.0% |
| Koreans | 77.5 /100 | #146 | Good 11.0% |
| Immigrants | Croatia | 77.3 /100 | #147 | Good 11.0% |
| Sudanese | 77.1 /100 | #148 | Good 11.0% |
| Immigrants | Denmark | 76.4 /100 | #149 | Good 11.0% |
| Immigrants | Guatemala | 75.1 /100 | #150 | Good 11.0% |
| Cubans | 74.9 /100 | #151 | Good 11.0% |
| Immigrants | Albania | 74.4 /100 | #152 | Good 11.0% |
| Immigrants | Northern Europe | 73.2 /100 | #153 | Good 11.1% |