Nepalese vs Korean Male Disability
COMPARE
Nepalese
Korean
Male Disability
Male Disability Comparison
Nepalese
Koreans
12.2%
MALE DISABILITY
0.2/ 100
METRIC RATING
264th/ 347
METRIC RANK
11.0%
MALE DISABILITY
77.5/ 100
METRIC RATING
146th/ 347
METRIC RANK
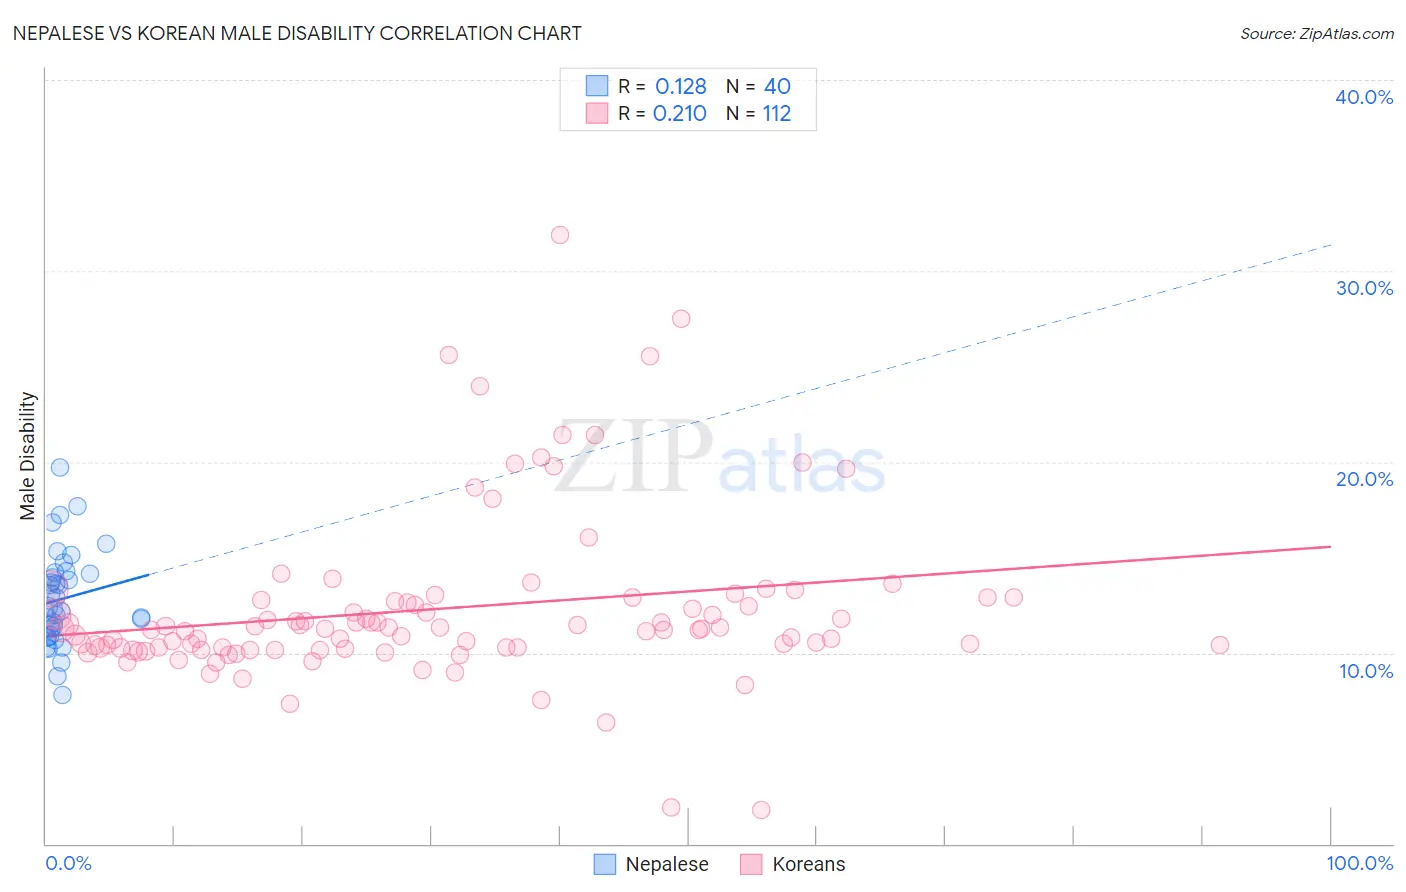
Nepalese vs Korean Male Disability Correlation Chart
The statistical analysis conducted on geographies consisting of 24,521,755 people shows a poor positive correlation between the proportion of Nepalese and percentage of males with a disability in the United States with a correlation coefficient (R) of 0.128 and weighted average of 12.2%. Similarly, the statistical analysis conducted on geographies consisting of 510,777,181 people shows a weak positive correlation between the proportion of Koreans and percentage of males with a disability in the United States with a correlation coefficient (R) of 0.210 and weighted average of 11.0%, a difference of 10.7%.
Male Disability Correlation Summary
| Measurement | Nepalese | Korean |
| Minimum | 7.8% | 1.8% |
| Maximum | 19.7% | 31.9% |
| Range | 11.9% | 30.1% |
| Mean | 12.8% | 12.3% |
| Median | 12.4% | 11.3% |
| Interquartile 25% (IQ1) | 11.1% | 10.3% |
| Interquartile 75% (IQ3) | 14.2% | 12.8% |
| Interquartile Range (IQR) | 3.1% | 2.5% |
| Standard Deviation (Sample) | 2.5% | 4.5% |
| Standard Deviation (Population) | 2.5% | 4.5% |
Similar Demographics by Male Disability
Demographics Similar to Nepalese by Male Disability
In terms of male disability, the demographic groups most similar to Nepalese are Canadian (12.2%, a difference of 0.030%), Norwegian (12.2%, a difference of 0.23%), Slavic (12.2%, a difference of 0.25%), Immigrants from Portugal (12.3%, a difference of 0.46%), and Hawaiian (12.3%, a difference of 0.47%).
| Demographics | Rating | Rank | Male Disability |
| Europeans | 0.3 /100 | #257 | Tragic 12.1% |
| Basques | 0.3 /100 | #258 | Tragic 12.1% |
| Belgians | 0.3 /100 | #259 | Tragic 12.1% |
| Swedes | 0.3 /100 | #260 | Tragic 12.1% |
| Slavs | 0.2 /100 | #261 | Tragic 12.2% |
| Norwegians | 0.2 /100 | #262 | Tragic 12.2% |
| Canadians | 0.2 /100 | #263 | Tragic 12.2% |
| Nepalese | 0.2 /100 | #264 | Tragic 12.2% |
| Immigrants | Portugal | 0.1 /100 | #265 | Tragic 12.3% |
| Hawaiians | 0.1 /100 | #266 | Tragic 12.3% |
| Immigrants | Germany | 0.1 /100 | #267 | Tragic 12.3% |
| Portuguese | 0.1 /100 | #268 | Tragic 12.3% |
| Czechoslovakians | 0.1 /100 | #269 | Tragic 12.3% |
| Spaniards | 0.1 /100 | #270 | Tragic 12.3% |
| Scandinavians | 0.1 /100 | #271 | Tragic 12.3% |
Demographics Similar to Koreans by Male Disability
In terms of male disability, the demographic groups most similar to Koreans are Immigrants from Croatia (11.0%, a difference of 0.020%), Sudanese (11.0%, a difference of 0.030%), Costa Rican (11.0%, a difference of 0.040%), Kenyan (11.0%, a difference of 0.050%), and Immigrants from Denmark (11.0%, a difference of 0.090%).
| Demographics | Rating | Rank | Male Disability |
| South Africans | 81.7 /100 | #139 | Excellent 11.0% |
| Immigrants | Italy | 81.5 /100 | #140 | Excellent 11.0% |
| Arabs | 81.5 /100 | #141 | Excellent 11.0% |
| Immigrants | Sudan | 81.5 /100 | #142 | Excellent 11.0% |
| Moroccans | 80.7 /100 | #143 | Excellent 11.0% |
| Kenyans | 78.1 /100 | #144 | Good 11.0% |
| Costa Ricans | 78.0 /100 | #145 | Good 11.0% |
| Koreans | 77.5 /100 | #146 | Good 11.0% |
| Immigrants | Croatia | 77.3 /100 | #147 | Good 11.0% |
| Sudanese | 77.1 /100 | #148 | Good 11.0% |
| Immigrants | Denmark | 76.4 /100 | #149 | Good 11.0% |
| Immigrants | Guatemala | 75.1 /100 | #150 | Good 11.0% |
| Cubans | 74.9 /100 | #151 | Good 11.0% |
| Immigrants | Albania | 74.4 /100 | #152 | Good 11.0% |
| Immigrants | Northern Europe | 73.2 /100 | #153 | Good 11.1% |