Immigrants from Bolivia vs Korean Male Disability
COMPARE
Immigrants from Bolivia
Korean
Male Disability
Male Disability Comparison
Immigrants from Bolivia
Koreans
9.5%
MALE DISABILITY
100.0/ 100
METRIC RATING
7th/ 347
METRIC RANK
11.0%
MALE DISABILITY
77.5/ 100
METRIC RATING
146th/ 347
METRIC RANK
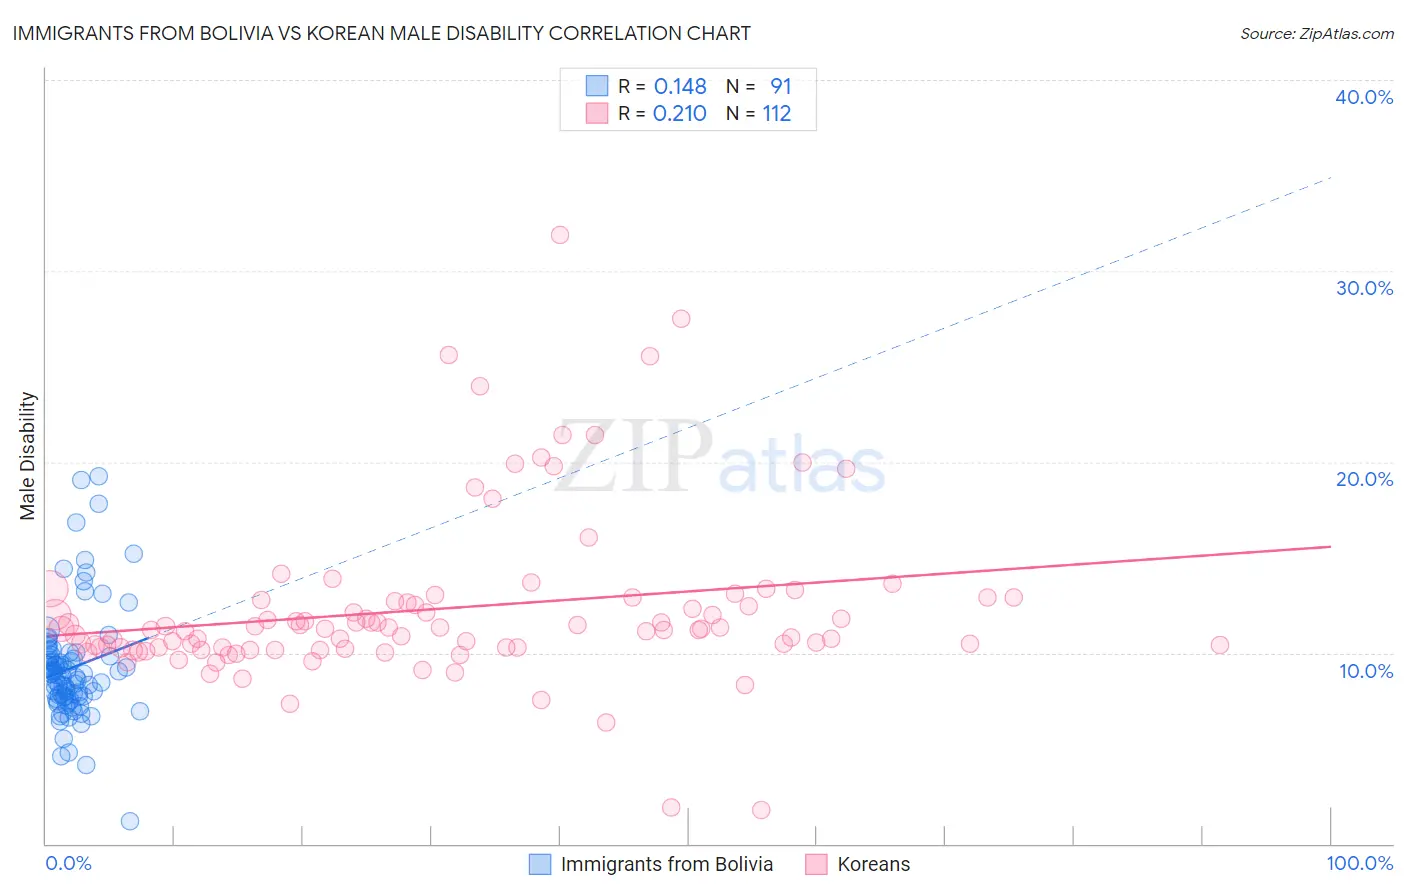
Immigrants from Bolivia vs Korean Male Disability Correlation Chart
The statistical analysis conducted on geographies consisting of 158,713,247 people shows a poor positive correlation between the proportion of Immigrants from Bolivia and percentage of males with a disability in the United States with a correlation coefficient (R) of 0.148 and weighted average of 9.5%. Similarly, the statistical analysis conducted on geographies consisting of 510,777,181 people shows a weak positive correlation between the proportion of Koreans and percentage of males with a disability in the United States with a correlation coefficient (R) of 0.210 and weighted average of 11.0%, a difference of 16.5%.
Male Disability Correlation Summary
| Measurement | Immigrants from Bolivia | Korean |
| Minimum | 1.2% | 1.8% |
| Maximum | 19.2% | 31.9% |
| Range | 18.0% | 30.1% |
| Mean | 9.2% | 12.3% |
| Median | 8.8% | 11.3% |
| Interquartile 25% (IQ1) | 7.7% | 10.3% |
| Interquartile 75% (IQ3) | 9.9% | 12.8% |
| Interquartile Range (IQR) | 2.2% | 2.5% |
| Standard Deviation (Sample) | 3.0% | 4.5% |
| Standard Deviation (Population) | 3.0% | 4.5% |
Similar Demographics by Male Disability
Demographics Similar to Immigrants from Bolivia by Male Disability
In terms of male disability, the demographic groups most similar to Immigrants from Bolivia are Immigrants from South Central Asia (9.4%, a difference of 0.33%), Immigrants from Hong Kong (9.4%, a difference of 0.39%), Immigrants from China (9.5%, a difference of 0.60%), Immigrants from Singapore (9.5%, a difference of 0.68%), and Immigrants from Israel (9.6%, a difference of 1.1%).
| Demographics | Rating | Rank | Male Disability |
| Immigrants | India | 100.0 /100 | #1 | Exceptional 9.0% |
| Immigrants | Taiwan | 100.0 /100 | #2 | Exceptional 9.1% |
| Filipinos | 100.0 /100 | #3 | Exceptional 9.1% |
| Thais | 100.0 /100 | #4 | Exceptional 9.2% |
| Immigrants | Hong Kong | 100.0 /100 | #5 | Exceptional 9.4% |
| Immigrants | South Central Asia | 100.0 /100 | #6 | Exceptional 9.4% |
| Immigrants | Bolivia | 100.0 /100 | #7 | Exceptional 9.5% |
| Immigrants | China | 100.0 /100 | #8 | Exceptional 9.5% |
| Immigrants | Singapore | 100.0 /100 | #9 | Exceptional 9.5% |
| Immigrants | Israel | 100.0 /100 | #10 | Exceptional 9.6% |
| Immigrants | Eastern Asia | 100.0 /100 | #11 | Exceptional 9.6% |
| Bolivians | 100.0 /100 | #12 | Exceptional 9.6% |
| Iranians | 100.0 /100 | #13 | Exceptional 9.7% |
| Immigrants | Iran | 100.0 /100 | #14 | Exceptional 9.7% |
| Indians (Asian) | 100.0 /100 | #15 | Exceptional 9.7% |
Demographics Similar to Koreans by Male Disability
In terms of male disability, the demographic groups most similar to Koreans are Immigrants from Croatia (11.0%, a difference of 0.020%), Sudanese (11.0%, a difference of 0.030%), Costa Rican (11.0%, a difference of 0.040%), Kenyan (11.0%, a difference of 0.050%), and Immigrants from Denmark (11.0%, a difference of 0.090%).
| Demographics | Rating | Rank | Male Disability |
| South Africans | 81.7 /100 | #139 | Excellent 11.0% |
| Immigrants | Italy | 81.5 /100 | #140 | Excellent 11.0% |
| Arabs | 81.5 /100 | #141 | Excellent 11.0% |
| Immigrants | Sudan | 81.5 /100 | #142 | Excellent 11.0% |
| Moroccans | 80.7 /100 | #143 | Excellent 11.0% |
| Kenyans | 78.1 /100 | #144 | Good 11.0% |
| Costa Ricans | 78.0 /100 | #145 | Good 11.0% |
| Koreans | 77.5 /100 | #146 | Good 11.0% |
| Immigrants | Croatia | 77.3 /100 | #147 | Good 11.0% |
| Sudanese | 77.1 /100 | #148 | Good 11.0% |
| Immigrants | Denmark | 76.4 /100 | #149 | Good 11.0% |
| Immigrants | Guatemala | 75.1 /100 | #150 | Good 11.0% |
| Cubans | 74.9 /100 | #151 | Good 11.0% |
| Immigrants | Albania | 74.4 /100 | #152 | Good 11.0% |
| Immigrants | Northern Europe | 73.2 /100 | #153 | Good 11.1% |