Immigrants from Turkey vs Immigrants from Romania Doctorate Degree
COMPARE
Immigrants from Turkey
Immigrants from Romania
Doctorate Degree
Doctorate Degree Comparison
Immigrants from Turkey
Immigrants from Romania
2.6%
DOCTORATE DEGREE
100.0/ 100
METRIC RATING
27th/ 347
METRIC RANK
2.1%
DOCTORATE DEGREE
98.7/ 100
METRIC RATING
95th/ 347
METRIC RANK
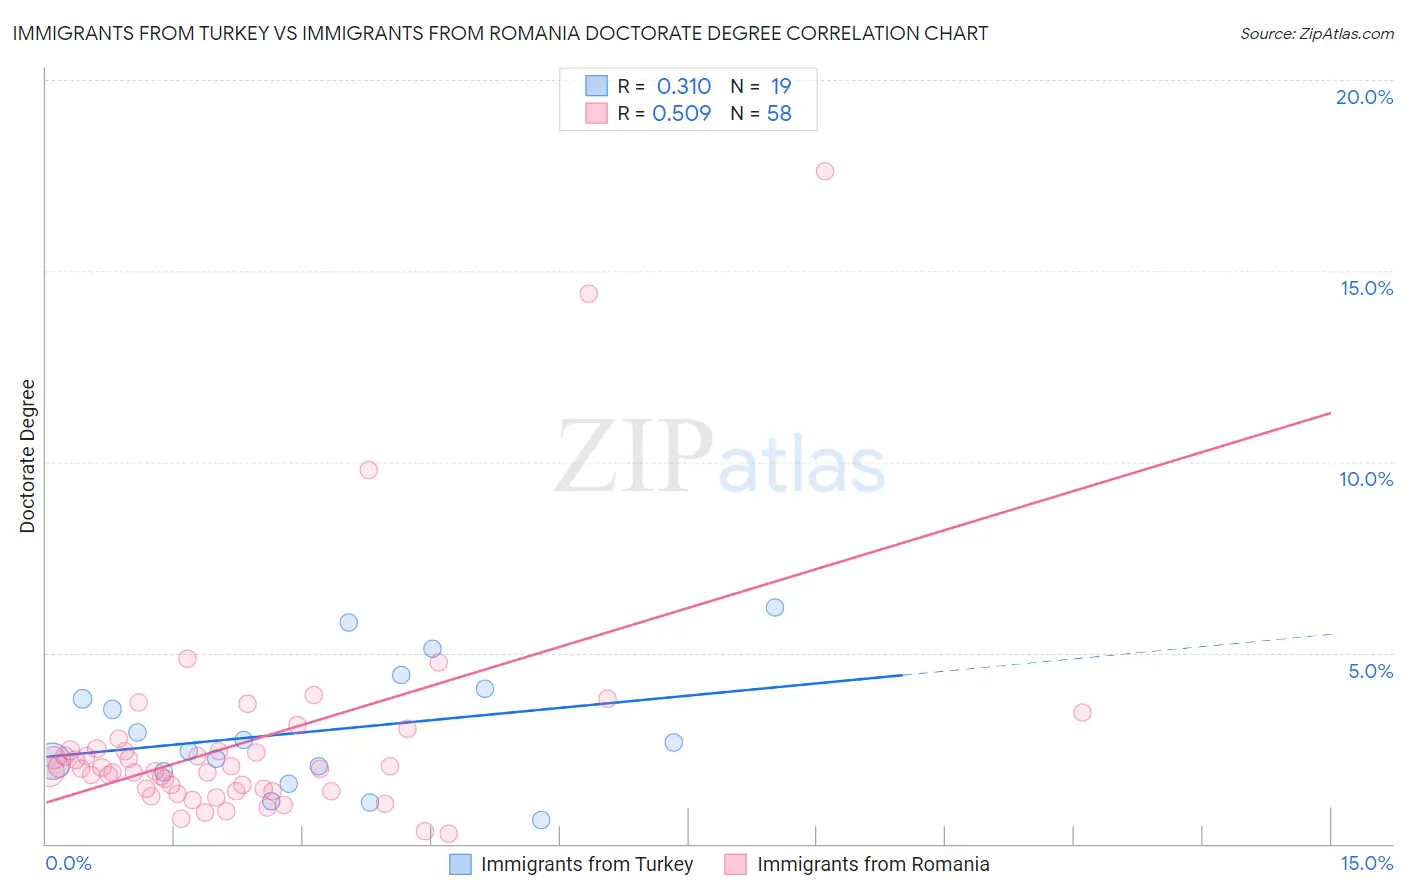
Immigrants from Turkey vs Immigrants from Romania Doctorate Degree Correlation Chart
The statistical analysis conducted on geographies consisting of 222,587,389 people shows a mild positive correlation between the proportion of Immigrants from Turkey and percentage of population with at least doctorate degree education in the United States with a correlation coefficient (R) of 0.310 and weighted average of 2.6%. Similarly, the statistical analysis conducted on geographies consisting of 256,246,165 people shows a substantial positive correlation between the proportion of Immigrants from Romania and percentage of population with at least doctorate degree education in the United States with a correlation coefficient (R) of 0.509 and weighted average of 2.1%, a difference of 24.1%.
Doctorate Degree Correlation Summary
| Measurement | Immigrants from Turkey | Immigrants from Romania |
| Minimum | 0.63% | 0.25% |
| Maximum | 6.2% | 17.6% |
| Range | 5.6% | 17.4% |
| Mean | 3.0% | 2.7% |
| Median | 2.6% | 2.0% |
| Interquartile 25% (IQ1) | 1.9% | 1.4% |
| Interquartile 75% (IQ3) | 4.1% | 2.4% |
| Interquartile Range (IQR) | 2.2% | 1.1% |
| Standard Deviation (Sample) | 1.6% | 2.9% |
| Standard Deviation (Population) | 1.5% | 2.9% |
Similar Demographics by Doctorate Degree
Demographics Similar to Immigrants from Turkey by Doctorate Degree
In terms of doctorate degree, the demographic groups most similar to Immigrants from Turkey are Burmese (2.6%, a difference of 0.30%), Immigrants from South Central Asia (2.6%, a difference of 0.57%), Immigrants from Korea (2.6%, a difference of 0.61%), Turkish (2.7%, a difference of 0.87%), and Immigrants from Saudi Arabia (2.7%, a difference of 1.4%).
| Demographics | Rating | Rank | Doctorate Degree |
| Immigrants | Hong Kong | 100.0 /100 | #20 | Exceptional 2.8% |
| Thais | 100.0 /100 | #21 | Exceptional 2.8% |
| Mongolians | 100.0 /100 | #22 | Exceptional 2.8% |
| Immigrants | Denmark | 100.0 /100 | #23 | Exceptional 2.8% |
| Israelis | 100.0 /100 | #24 | Exceptional 2.7% |
| Immigrants | Saudi Arabia | 100.0 /100 | #25 | Exceptional 2.7% |
| Turks | 100.0 /100 | #26 | Exceptional 2.7% |
| Immigrants | Turkey | 100.0 /100 | #27 | Exceptional 2.6% |
| Burmese | 100.0 /100 | #28 | Exceptional 2.6% |
| Immigrants | South Central Asia | 100.0 /100 | #29 | Exceptional 2.6% |
| Immigrants | Korea | 100.0 /100 | #30 | Exceptional 2.6% |
| Latvians | 100.0 /100 | #31 | Exceptional 2.6% |
| Immigrants | Northern Europe | 100.0 /100 | #32 | Exceptional 2.6% |
| Cambodians | 100.0 /100 | #33 | Exceptional 2.6% |
| Cypriots | 100.0 /100 | #34 | Exceptional 2.6% |
Demographics Similar to Immigrants from Romania by Doctorate Degree
In terms of doctorate degree, the demographic groups most similar to Immigrants from Romania are Greek (2.1%, a difference of 0.15%), Immigrants from Northern Africa (2.1%, a difference of 0.59%), Immigrants from Eritrea (2.1%, a difference of 0.72%), Alsatian (2.1%, a difference of 0.78%), and Armenian (2.1%, a difference of 0.80%).
| Demographics | Rating | Rank | Doctorate Degree |
| Immigrants | Nepal | 99.3 /100 | #88 | Exceptional 2.2% |
| British | 99.3 /100 | #89 | Exceptional 2.2% |
| Immigrants | Scotland | 99.2 /100 | #90 | Exceptional 2.2% |
| Immigrants | Sudan | 99.1 /100 | #91 | Exceptional 2.2% |
| Chileans | 99.1 /100 | #92 | Exceptional 2.2% |
| Alsatians | 99.0 /100 | #93 | Exceptional 2.1% |
| Greeks | 98.8 /100 | #94 | Exceptional 2.1% |
| Immigrants | Romania | 98.7 /100 | #95 | Exceptional 2.1% |
| Immigrants | Northern Africa | 98.4 /100 | #96 | Exceptional 2.1% |
| Immigrants | Eritrea | 98.4 /100 | #97 | Exceptional 2.1% |
| Armenians | 98.3 /100 | #98 | Exceptional 2.1% |
| Immigrants | Egypt | 98.2 /100 | #99 | Exceptional 2.1% |
| Immigrants | Eastern Europe | 98.2 /100 | #100 | Exceptional 2.1% |
| Immigrants | Eastern Africa | 98.2 /100 | #101 | Exceptional 2.1% |
| Immigrants | Chile | 98.1 /100 | #102 | Exceptional 2.1% |