Immigrants from Taiwan vs Peruvian Disability Age 35 to 64
COMPARE
Immigrants from Taiwan
Peruvian
Disability Age 35 to 64
Disability Age 35 to 64 Comparison
Immigrants from Taiwan
Peruvians
7.8%
DISABILITY AGE 35 TO 64
100.0/ 100
METRIC RATING
1st/ 347
METRIC RANK
9.9%
DISABILITY AGE 35 TO 64
99.8/ 100
METRIC RATING
55th/ 347
METRIC RANK
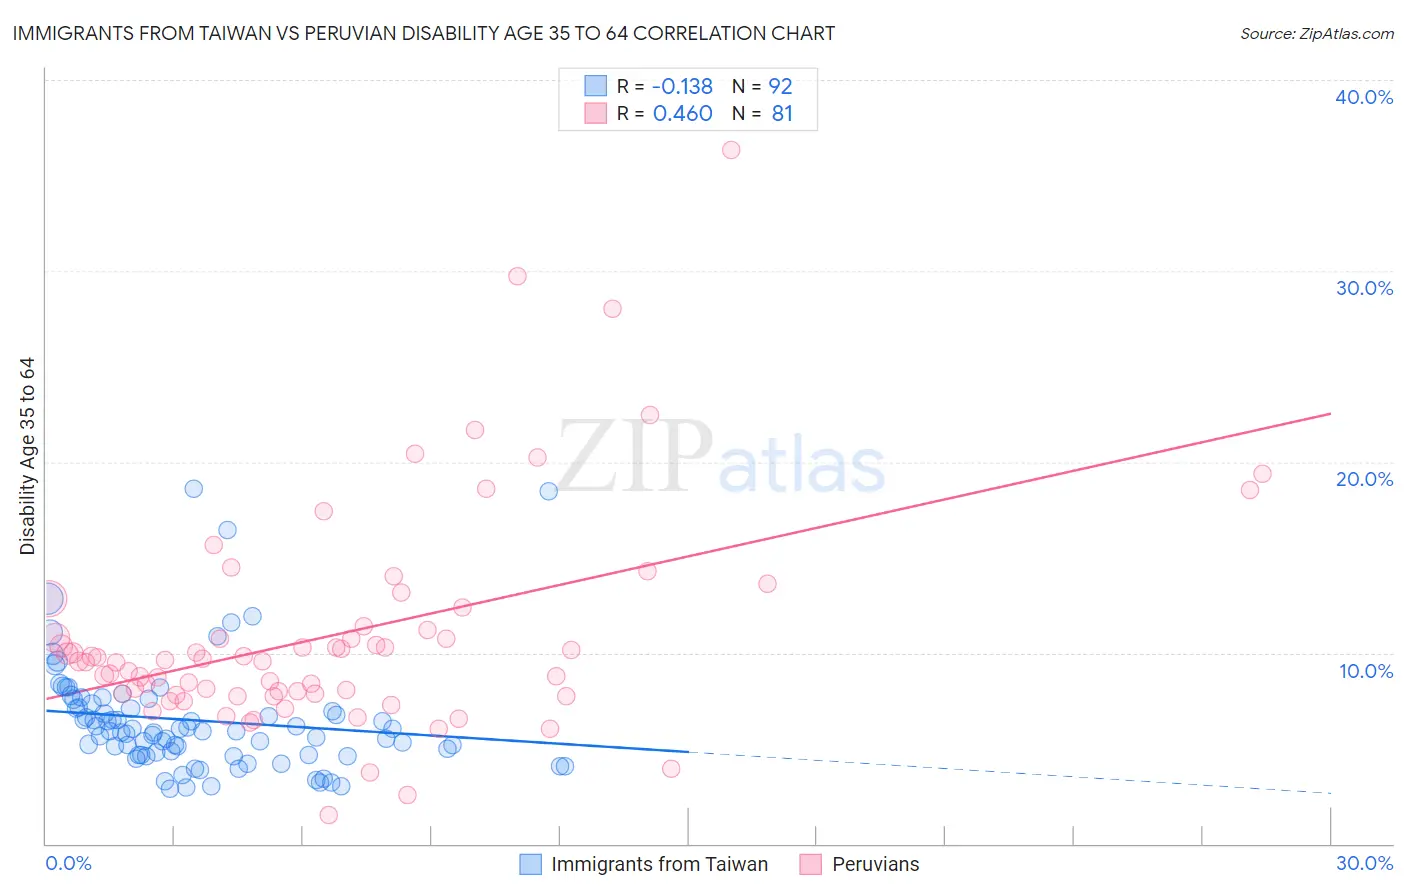
Immigrants from Taiwan vs Peruvian Disability Age 35 to 64 Correlation Chart
The statistical analysis conducted on geographies consisting of 298,104,424 people shows a poor negative correlation between the proportion of Immigrants from Taiwan and percentage of population with a disability between the ages 34 and 64 in the United States with a correlation coefficient (R) of -0.138 and weighted average of 7.8%. Similarly, the statistical analysis conducted on geographies consisting of 362,944,439 people shows a moderate positive correlation between the proportion of Peruvians and percentage of population with a disability between the ages 34 and 64 in the United States with a correlation coefficient (R) of 0.460 and weighted average of 9.9%, a difference of 25.6%.
Disability Age 35 to 64 Correlation Summary
| Measurement | Immigrants from Taiwan | Peruvian |
| Minimum | 2.9% | 1.5% |
| Maximum | 18.6% | 36.3% |
| Range | 15.7% | 34.8% |
| Mean | 6.5% | 10.9% |
| Median | 5.9% | 9.6% |
| Interquartile 25% (IQ1) | 4.7% | 7.8% |
| Interquartile 75% (IQ3) | 7.2% | 11.3% |
| Interquartile Range (IQR) | 2.5% | 3.5% |
| Standard Deviation (Sample) | 2.9% | 5.8% |
| Standard Deviation (Population) | 2.9% | 5.7% |
Similar Demographics by Disability Age 35 to 64
Demographics Similar to Immigrants from Taiwan by Disability Age 35 to 64
In terms of disability age 35 to 64, the demographic groups most similar to Immigrants from Taiwan are Filipino (8.0%, a difference of 2.5%), Immigrants from Hong Kong (8.2%, a difference of 4.4%), Immigrants from India (8.3%, a difference of 5.5%), Immigrants from Iran (8.5%, a difference of 8.2%), and Thai (8.6%, a difference of 9.2%).
| Demographics | Rating | Rank | Disability Age 35 to 64 |
| Immigrants | Taiwan | 100.0 /100 | #1 | Exceptional 7.8% |
| Filipinos | 100.0 /100 | #2 | Exceptional 8.0% |
| Immigrants | Hong Kong | 100.0 /100 | #3 | Exceptional 8.2% |
| Immigrants | India | 100.0 /100 | #4 | Exceptional 8.3% |
| Immigrants | Iran | 100.0 /100 | #5 | Exceptional 8.5% |
| Thais | 100.0 /100 | #6 | Exceptional 8.6% |
| Immigrants | Israel | 100.0 /100 | #7 | Exceptional 8.6% |
| Iranians | 100.0 /100 | #8 | Exceptional 8.7% |
| Immigrants | China | 100.0 /100 | #9 | Exceptional 8.7% |
| Immigrants | Bolivia | 100.0 /100 | #10 | Exceptional 8.7% |
| Immigrants | Eastern Asia | 100.0 /100 | #11 | Exceptional 8.8% |
| Indians (Asian) | 100.0 /100 | #12 | Exceptional 8.9% |
| Immigrants | South Central Asia | 100.0 /100 | #13 | Exceptional 8.9% |
| Immigrants | Singapore | 100.0 /100 | #14 | Exceptional 8.9% |
| Bolivians | 100.0 /100 | #15 | Exceptional 8.9% |
Demographics Similar to Peruvians by Disability Age 35 to 64
In terms of disability age 35 to 64, the demographic groups most similar to Peruvians are Immigrants from Russia (9.8%, a difference of 0.060%), Taiwanese (9.8%, a difference of 0.10%), Immigrants from Bulgaria (9.8%, a difference of 0.16%), Bhutanese (9.8%, a difference of 0.17%), and South American (9.9%, a difference of 0.22%).
| Demographics | Rating | Rank | Disability Age 35 to 64 |
| Immigrants | Serbia | 99.8 /100 | #48 | Exceptional 9.8% |
| Immigrants | Greece | 99.8 /100 | #49 | Exceptional 9.8% |
| Paraguayans | 99.8 /100 | #50 | Exceptional 9.8% |
| Bhutanese | 99.8 /100 | #51 | Exceptional 9.8% |
| Immigrants | Bulgaria | 99.8 /100 | #52 | Exceptional 9.8% |
| Taiwanese | 99.8 /100 | #53 | Exceptional 9.8% |
| Immigrants | Russia | 99.8 /100 | #54 | Exceptional 9.8% |
| Peruvians | 99.8 /100 | #55 | Exceptional 9.9% |
| South Americans | 99.8 /100 | #56 | Exceptional 9.9% |
| Colombians | 99.8 /100 | #57 | Exceptional 9.9% |
| Armenians | 99.8 /100 | #58 | Exceptional 9.9% |
| Immigrants | Sweden | 99.7 /100 | #59 | Exceptional 9.9% |
| Immigrants | South America | 99.7 /100 | #60 | Exceptional 9.9% |
| Immigrants | Spain | 99.7 /100 | #61 | Exceptional 10.0% |
| Eastern Europeans | 99.7 /100 | #62 | Exceptional 10.0% |