Immigrants from Taiwan vs Celtic Disability Age 35 to 64
COMPARE
Immigrants from Taiwan
Celtic
Disability Age 35 to 64
Disability Age 35 to 64 Comparison
Immigrants from Taiwan
Celtics
7.8%
DISABILITY AGE 35 TO 64
100.0/ 100
METRIC RATING
1st/ 347
METRIC RANK
12.9%
DISABILITY AGE 35 TO 64
0.1/ 100
METRIC RATING
274th/ 347
METRIC RANK
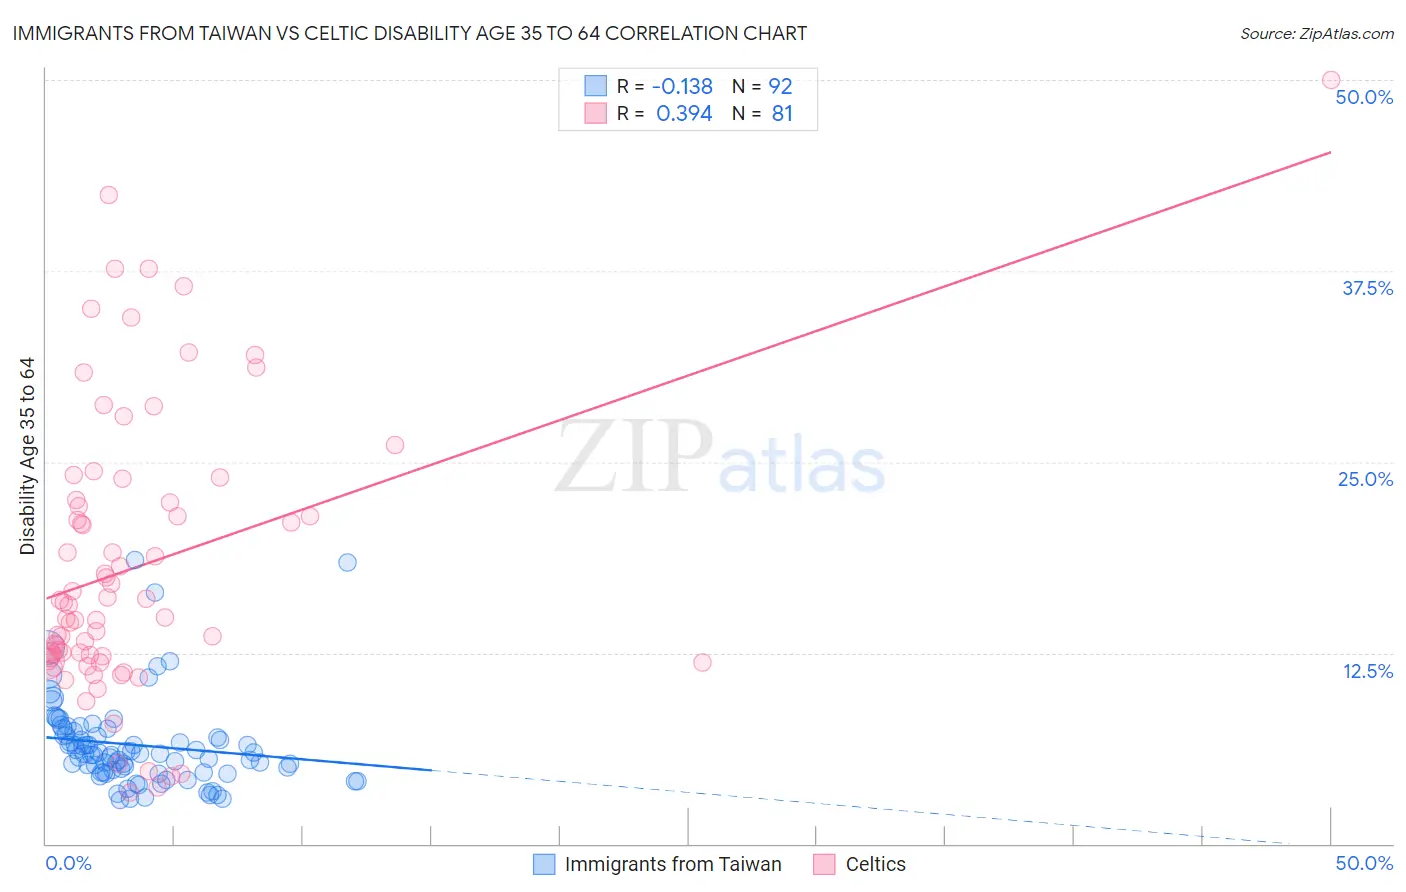
Immigrants from Taiwan vs Celtic Disability Age 35 to 64 Correlation Chart
The statistical analysis conducted on geographies consisting of 298,104,424 people shows a poor negative correlation between the proportion of Immigrants from Taiwan and percentage of population with a disability between the ages 34 and 64 in the United States with a correlation coefficient (R) of -0.138 and weighted average of 7.8%. Similarly, the statistical analysis conducted on geographies consisting of 168,843,567 people shows a mild positive correlation between the proportion of Celtics and percentage of population with a disability between the ages 34 and 64 in the United States with a correlation coefficient (R) of 0.394 and weighted average of 12.9%, a difference of 63.7%.
Disability Age 35 to 64 Correlation Summary
| Measurement | Immigrants from Taiwan | Celtic |
| Minimum | 2.9% | 3.4% |
| Maximum | 18.6% | 50.0% |
| Range | 15.7% | 46.6% |
| Mean | 6.5% | 18.2% |
| Median | 5.9% | 15.6% |
| Interquartile 25% (IQ1) | 4.7% | 12.1% |
| Interquartile 75% (IQ3) | 7.2% | 22.4% |
| Interquartile Range (IQR) | 2.5% | 10.3% |
| Standard Deviation (Sample) | 2.9% | 9.4% |
| Standard Deviation (Population) | 2.9% | 9.3% |
Similar Demographics by Disability Age 35 to 64
Demographics Similar to Immigrants from Taiwan by Disability Age 35 to 64
In terms of disability age 35 to 64, the demographic groups most similar to Immigrants from Taiwan are Filipino (8.0%, a difference of 2.5%), Immigrants from Hong Kong (8.2%, a difference of 4.4%), Immigrants from India (8.3%, a difference of 5.5%), Immigrants from Iran (8.5%, a difference of 8.2%), and Thai (8.6%, a difference of 9.2%).
| Demographics | Rating | Rank | Disability Age 35 to 64 |
| Immigrants | Taiwan | 100.0 /100 | #1 | Exceptional 7.8% |
| Filipinos | 100.0 /100 | #2 | Exceptional 8.0% |
| Immigrants | Hong Kong | 100.0 /100 | #3 | Exceptional 8.2% |
| Immigrants | India | 100.0 /100 | #4 | Exceptional 8.3% |
| Immigrants | Iran | 100.0 /100 | #5 | Exceptional 8.5% |
| Thais | 100.0 /100 | #6 | Exceptional 8.6% |
| Immigrants | Israel | 100.0 /100 | #7 | Exceptional 8.6% |
| Iranians | 100.0 /100 | #8 | Exceptional 8.7% |
| Immigrants | China | 100.0 /100 | #9 | Exceptional 8.7% |
| Immigrants | Bolivia | 100.0 /100 | #10 | Exceptional 8.7% |
| Immigrants | Eastern Asia | 100.0 /100 | #11 | Exceptional 8.8% |
| Indians (Asian) | 100.0 /100 | #12 | Exceptional 8.9% |
| Immigrants | South Central Asia | 100.0 /100 | #13 | Exceptional 8.9% |
| Immigrants | Singapore | 100.0 /100 | #14 | Exceptional 8.9% |
| Bolivians | 100.0 /100 | #15 | Exceptional 8.9% |
Demographics Similar to Celtics by Disability Age 35 to 64
In terms of disability age 35 to 64, the demographic groups most similar to Celtics are Pennsylvania German (12.8%, a difference of 0.030%), U.S. Virgin Islander (12.8%, a difference of 0.11%), Dominican (12.9%, a difference of 0.14%), Nepalese (12.8%, a difference of 0.23%), and Somali (12.9%, a difference of 0.26%).
| Demographics | Rating | Rank | Disability Age 35 to 64 |
| Sub-Saharan Africans | 0.2 /100 | #267 | Tragic 12.6% |
| Immigrants | Dominica | 0.2 /100 | #268 | Tragic 12.7% |
| Spanish | 0.2 /100 | #269 | Tragic 12.7% |
| French | 0.2 /100 | #270 | Tragic 12.7% |
| Nepalese | 0.1 /100 | #271 | Tragic 12.8% |
| U.S. Virgin Islanders | 0.1 /100 | #272 | Tragic 12.8% |
| Pennsylvania Germans | 0.1 /100 | #273 | Tragic 12.8% |
| Celtics | 0.1 /100 | #274 | Tragic 12.9% |
| Dominicans | 0.1 /100 | #275 | Tragic 12.9% |
| Somalis | 0.1 /100 | #276 | Tragic 12.9% |
| Immigrants | Dominican Republic | 0.1 /100 | #277 | Tragic 12.9% |
| French Canadians | 0.1 /100 | #278 | Tragic 12.9% |
| Immigrants | Micronesia | 0.1 /100 | #279 | Tragic 12.9% |
| Liberians | 0.1 /100 | #280 | Tragic 12.9% |
| Scotch-Irish | 0.1 /100 | #281 | Tragic 13.0% |