Immigrants from Taiwan vs Serbian Disability Age 35 to 64

COMPARE

Immigrants from Taiwan
Race
Ancestry
AfghanAfricanAlaska NativeAlaskan AthabascanAlbanianAleutAlsatianAmericanApacheArabArapahoArgentineanArmenianAssyrian/Chaldean/SyriacAustralianAustrianBahamianBangladeshiBarbadianBasqueBelgianBelizeanBermudanBhutaneseBlackfeetBolivianBrazilianBritishBritish West IndianBulgarianBurmeseCajunCambodianCanadianCape VerdeanCarpatho RusynCelticCentral AmericanCentral American IndianCherokeeCheyenneChickasawChileanChineseChippewaChoctawColombianColvilleComancheCosta RicanCreeCreekCroatianCrowCubanCypriotCzechCzechoslovakianDanishDelawareDominicanDutchDutch West IndianEastern EuropeanEcuadorianEgyptianEnglishEstonianEthiopianEuropeanFijianFilipinoFinnishFrenchFrench American IndianFrench CanadianGermanGerman RussianGhanaianGreekGuamanian/ChamorroGuatemalanGuyaneseHaitianHmongHonduranHopiHoumaHungarianIcelanderIndian (Asian)IndonesianInupiatIranianIraqiIrishIroquoisIsraeliItalianJamaicanJapaneseJordanianKenyanKiowaKoreanLaotianLatvianLebaneseLiberianLithuanianLumbeeLuxembourgerMacedonianMalaysianMalteseMarshalleseMenomineeMexicanMexican American IndianMongolianMoroccanNative HawaiianNavajoNepaleseNew ZealanderNicaraguanNigerianNorthern EuropeanNorwegianOkinawanOsageOttawaPaiutePakistaniPalestinianPanamanianParaguayanPennsylvania GermanPeruvianPimaPolishPortuguesePotawatomiPuebloPuerto RicanPuget Sound SalishRomanianRussianSalvadoranSamoanScandinavianScotch-IrishScottishSeminoleSenegaleseShoshoneSierra LeoneanSiouxSlavicSlovakSloveneSomaliSouth AfricanSouth AmericanSouth American IndianSoviet UnionSpaniardSpanishSpanish AmericanSpanish American IndianSri LankanSubsaharan AfricanSudaneseSwedishSwissSyrianTaiwaneseThaiTlingit-HaidaTohono O'OdhamTonganTrinidadian and TobagonianTsimshianTurkishU.S. Virgin IslanderUgandanUkrainianUruguayanUteVenezuelanVietnameseWelshWest IndianYakamaYaquiYugoslavianYumanYup'ikZimbabwean
Immigration
NonimmigrantsImmigrantsAfghanistanAfricaAlbaniaArgentinaArmeniaAsiaAustraliaAustriaBahamasBangladeshBarbadosBelarusBelgiumBelizeBoliviaBosnia and HerzegovinaBrazilBulgariaBurma/MyanmarCabo VerdeCambodiaCameroonCanadaCaribbeanCentral AmericaChileChinaColombiaCongoCosta RicaCroatiaCubaCzechoslovakiaDenmarkDominicaDominican RepublicEastern AfricaEastern AsiaEastern EuropeEcuadorEgyptEl SalvadorEnglandEritreaEthiopiaEuropeFijiFranceGermanyGhanaGreeceGrenadaGuatemalaGuyanaHaitiHondurasHong KongHungaryIndiaIndonesiaIranIraqIrelandIsraelItalyJamaicaJapanJordanKazakhstanKenyaKoreaKuwaitLaosLatin AmericaLatviaLebanonLiberiaLithuaniaMalaysiaMexicoMicronesiaMiddle AfricaMoldovaMoroccoNepalNetherlandsNicaraguaNigeriaNorth AmericaNorth MacedoniaNorthern AfricaNorthern EuropeNorwayOceaniaPakistanPanamaPeruPhilippinesPolandPortugalRomaniaRussiaSaudi ArabiaScotlandSenegalSerbiaSierra LeoneSingaporeSomaliaSouth AfricaSouth AmericaSouth Central AsiaSouth Eastern AsiaSouthern EuropeSpainSri LankaSt. Vincent and the GrenadinesSudanSwedenSwitzerlandSyriaTaiwanThailandTrinidad and TobagoTurkeyUgandaUkraineUruguayUzbekistanVenezuelaVietnamWest IndiesWestern AfricaWestern AsiaWestern EuropeYemenZaireZimbabweAzores
Serbian
Race
Ancestry
AfghanAfricanAlaska NativeAlaskan AthabascanAlbanianAleutAlsatianAmericanApacheArabArapahoArgentineanArmenianAssyrian/Chaldean/SyriacAustralianAustrianBahamianBangladeshiBarbadianBasqueBelgianBelizeanBermudanBhutaneseBlackfeetBolivianBrazilianBritishBritish West IndianBulgarianBurmeseCajunCambodianCanadianCape VerdeanCarpatho RusynCelticCentral AmericanCentral American IndianCherokeeCheyenneChickasawChileanChineseChippewaChoctawColombianColvilleComancheCosta RicanCreeCreekCroatianCrowCubanCypriotCzechCzechoslovakianDanishDelawareDominicanDutchDutch West IndianEastern EuropeanEcuadorianEgyptianEnglishEstonianEthiopianEuropeanFijianFilipinoFinnishFrenchFrench American IndianFrench CanadianGermanGerman RussianGhanaianGreekGuamanian/ChamorroGuatemalanGuyaneseHaitianHmongHonduranHopiHoumaHungarianIcelanderIndian (Asian)IndonesianInupiatIranianIraqiIrishIroquoisIsraeliItalianJamaicanJapaneseJordanianKenyanKiowaKoreanLaotianLatvianLebaneseLiberianLithuanianLumbeeLuxembourgerMacedonianMalaysianMalteseMarshalleseMenomineeMexicanMexican American IndianMongolianMoroccanNative HawaiianNavajoNepaleseNew ZealanderNicaraguanNigerianNorthern EuropeanNorwegianOkinawanOsageOttawaPaiutePakistaniPalestinianPanamanianParaguayanPennsylvania GermanPeruvianPimaPolishPortuguesePotawatomiPuebloPuerto RicanPuget Sound SalishRomanianRussianSalvadoranSamoanScandinavianScotch-IrishScottishSeminoleSenegaleseSerbianShoshoneSierra LeoneanSiouxSlavicSlovakSloveneSomaliSouth AfricanSouth AmericanSouth American IndianSoviet UnionSpaniardSpanishSpanish AmericanSpanish American IndianSri LankanSubsaharan AfricanSudaneseSwedishSwissSyrianTaiwaneseThaiTlingit-HaidaTohono O'OdhamTonganTrinidadian and TobagonianTsimshianTurkishU.S. Virgin IslanderUgandanUkrainianUruguayanUteVenezuelanVietnameseWelshWest IndianYakamaYaquiYugoslavianYumanYup'ikZimbabwean
Immigration
NonimmigrantsImmigrantsAfghanistanAfricaAlbaniaArgentinaArmeniaAsiaAustraliaAustriaBahamasBangladeshBarbadosBelarusBelgiumBelizeBoliviaBosnia and HerzegovinaBrazilBulgariaBurma/MyanmarCabo VerdeCambodiaCameroonCanadaCaribbeanCentral AmericaChileChinaColombiaCongoCosta RicaCroatiaCubaCzechoslovakiaDenmarkDominicaDominican RepublicEastern AfricaEastern AsiaEastern EuropeEcuadorEgyptEl SalvadorEnglandEritreaEthiopiaEuropeFijiFranceGermanyGhanaGreeceGrenadaGuatemalaGuyanaHaitiHondurasHong KongHungaryIndiaIndonesiaIranIraqIrelandIsraelItalyJamaicaJapanJordanKazakhstanKenyaKoreaKuwaitLaosLatin AmericaLatviaLebanonLiberiaLithuaniaMalaysiaMexicoMicronesiaMiddle AfricaMoldovaMoroccoNepalNetherlandsNicaraguaNigeriaNorth AmericaNorth MacedoniaNorthern AfricaNorthern EuropeNorwayOceaniaPakistanPanamaPeruPhilippinesPolandPortugalRomaniaRussiaSaudi ArabiaScotlandSenegalSerbiaSierra LeoneSingaporeSomaliaSouth AfricaSouth AmericaSouth Central AsiaSouth Eastern AsiaSouthern EuropeSpainSri LankaSt. Vincent and the GrenadinesSudanSwedenSwitzerlandSyriaThailandTrinidad and TobagoTurkeyUgandaUkraineUruguayUzbekistanVenezuelaVietnamWest IndiesWestern AfricaWestern AsiaWestern EuropeYemenZaireZimbabweAzores
Disability Age 35 to 64
Income
Poverty
Unemployment
Labor Participation
Family Structure
Vehicle Availability
Education Level
Disability

Disability Age 35 to 64 Comparison

Immigrants from Taiwan

Serbians

Exceptional
Good
7.8%
DISABILITY AGE 35 TO 64
100.0/ 100
METRIC RATING
1st/ 347
METRIC RANK
11.0%
DISABILITY AGE 35 TO 64
73.6/ 100
METRIC RATING
159th/ 347
METRIC RANK

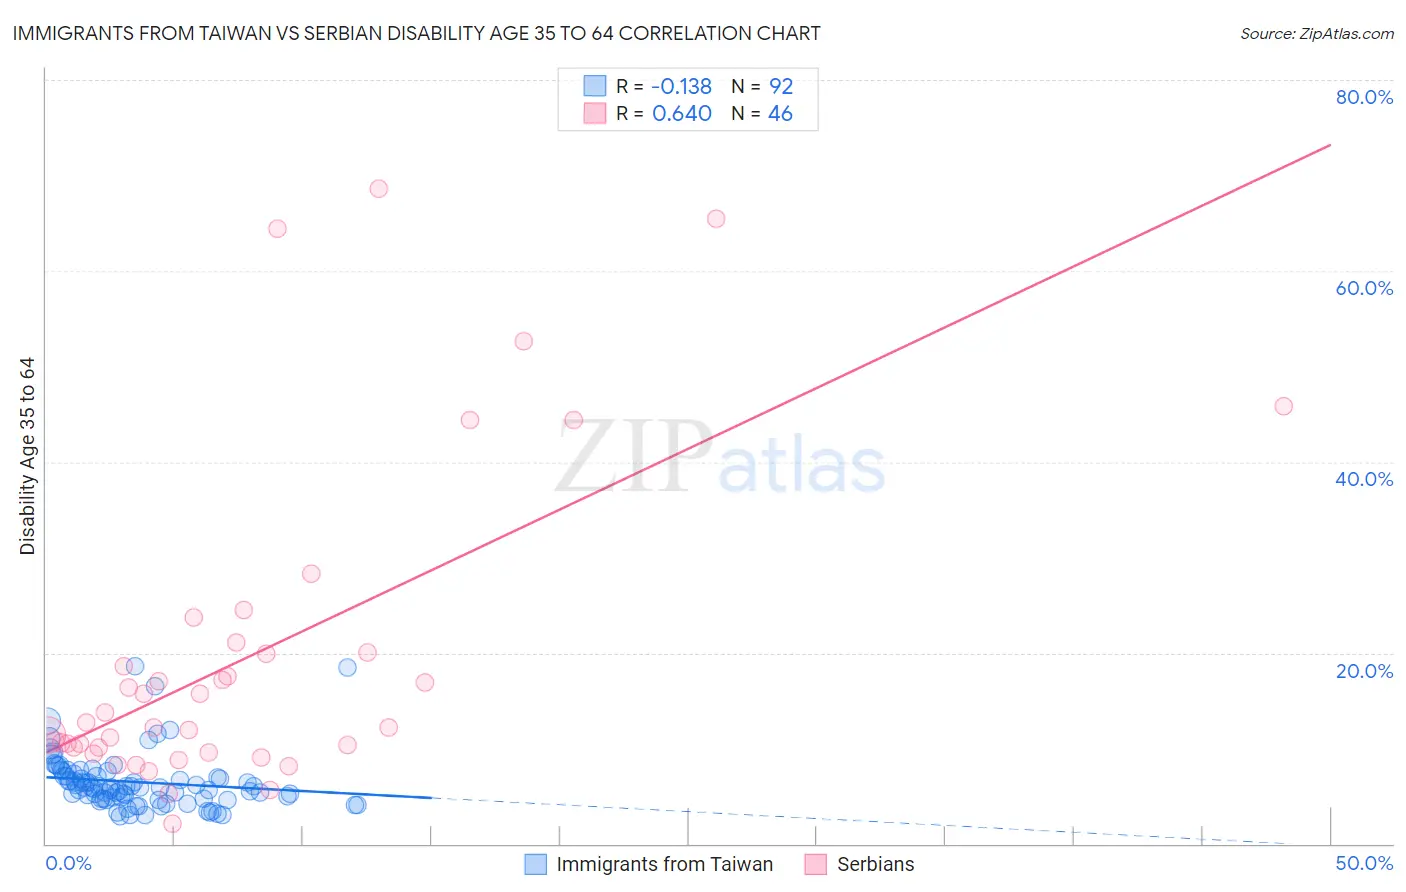
Immigrants from Taiwan vs Serbian Disability Age 35 to 64 Correlation Chart

The statistical analysis conducted on geographies consisting of 298,104,424 people shows a poor negative correlation between the proportion of Immigrants from Taiwan and percentage of population with a disability between the ages 34 and 64 in the United States with a correlation coefficient (R) of -0.138 and weighted average of 7.8%. Similarly, the statistical analysis conducted on geographies consisting of 267,515,714 people shows a significant positive correlation between the proportion of Serbians and percentage of population with a disability between the ages 34 and 64 in the United States with a correlation coefficient (R) of 0.640 and weighted average of 11.0%, a difference of 40.6%.
Immigrants from Taiwan vs Serbian Disability Age 35 to 64

Disability Age 35 to 64 Correlation Summary

MeasurementImmigrants from TaiwanSerbian
Minimum2.9%2.0%
Maximum18.6%68.6%
Range15.7%66.5%
Mean6.5%19.5%
Median5.9%12.4%
Interquartile 25% (IQ1)4.7%10.1%
Interquartile 75% (IQ3)7.2%20.0%
Interquartile Range (IQR)2.5%9.9%
Standard Deviation (Sample)2.9%16.6%
Standard Deviation (Population)2.9%16.4%

Similar Demographics by Disability Age 35 to 64

Demographics Similar to Immigrants from Taiwan by Disability Age 35 to 64

In terms of disability age 35 to 64, the demographic groups most similar to Immigrants from Taiwan are Filipino (8.0%, a difference of 2.5%), Immigrants from Hong Kong (8.2%, a difference of 4.4%), Immigrants from India (8.3%, a difference of 5.5%), Immigrants from Iran (8.5%, a difference of 8.2%), and Thai (8.6%, a difference of 9.2%).
DemographicsRating | RankDisability Age 35 to 64
Immigrants | Taiwan
100.0
/100
|
#1
Exceptional
7.8%
Filipinos
100.0
/100
|
#2
Exceptional
8.0%
Immigrants | Hong Kong
100.0
/100
|
#3
Exceptional
8.2%
Immigrants | India
100.0
/100
|
#4
Exceptional
8.3%
Immigrants | Iran
100.0
/100
|
#5
Exceptional
8.5%
Thais
100.0
/100
|
#6
Exceptional
8.6%
Immigrants | Israel
100.0
/100
|
#7
Exceptional
8.6%
Iranians
100.0
/100
|
#8
Exceptional
8.7%
Immigrants | China
100.0
/100
|
#9
Exceptional
8.7%
Immigrants | Bolivia
100.0
/100
|
#10
Exceptional
8.7%
Immigrants | Eastern Asia
100.0
/100
|
#11
Exceptional
8.8%
Indians (Asian)
100.0
/100
|
#12
Exceptional
8.9%
Immigrants | South Central Asia
100.0
/100
|
#13
Exceptional
8.9%
Immigrants | Singapore
100.0
/100
|
#14
Exceptional
8.9%
Bolivians
100.0
/100
|
#15
Exceptional
8.9%

Demographics Similar to Serbians by Disability Age 35 to 64

In terms of disability age 35 to 64, the demographic groups most similar to Serbians are Croatian (11.0%, a difference of 0.050%), Immigrants from North America (11.0%, a difference of 0.14%), Guyanese (11.0%, a difference of 0.16%), Immigrants from Sierra Leone (11.0%, a difference of 0.29%), and Moroccan (11.0%, a difference of 0.31%).
DemographicsRating | RankDisability Age 35 to 64
Ukrainians
78.0
/100
|
#152
Good
11.0%
Immigrants | England
77.4
/100
|
#153
Good
11.0%
Immigrants | Canada
76.7
/100
|
#154
Good
11.0%
Moroccans
76.4
/100
|
#155
Good
11.0%
Immigrants | Sierra Leone
76.2
/100
|
#156
Good
11.0%
Guyanese
75.1
/100
|
#157
Good
11.0%
Immigrants | North America
74.9
/100
|
#158
Good
11.0%
Serbians
73.6
/100
|
#159
Good
11.0%
Croatians
73.1
/100
|
#160
Good
11.0%
Immigrants | Guyana
70.1
/100
|
#161
Good
11.1%
Immigrants | Grenada
68.4
/100
|
#162
Good
11.1%
Immigrants | St. Vincent and the Grenadines
66.6
/100
|
#163
Good
11.1%
Pakistanis
65.8
/100
|
#164
Good
11.1%
Immigrants | Western Europe
65.2
/100
|
#165
Good
11.1%
Immigrants | Haiti
63.8
/100
|
#166
Good
11.1%