Crow vs Creek Disability Age 35 to 64
COMPARE
Crow
Creek
Disability Age 35 to 64
Disability Age 35 to 64 Comparison
Crow
Creek
14.6%
DISABILITY AGE 35 TO 64
0.0/ 100
METRIC RATING
317th/ 347
METRIC RANK
16.9%
DISABILITY AGE 35 TO 64
0.0/ 100
METRIC RATING
343rd/ 347
METRIC RANK
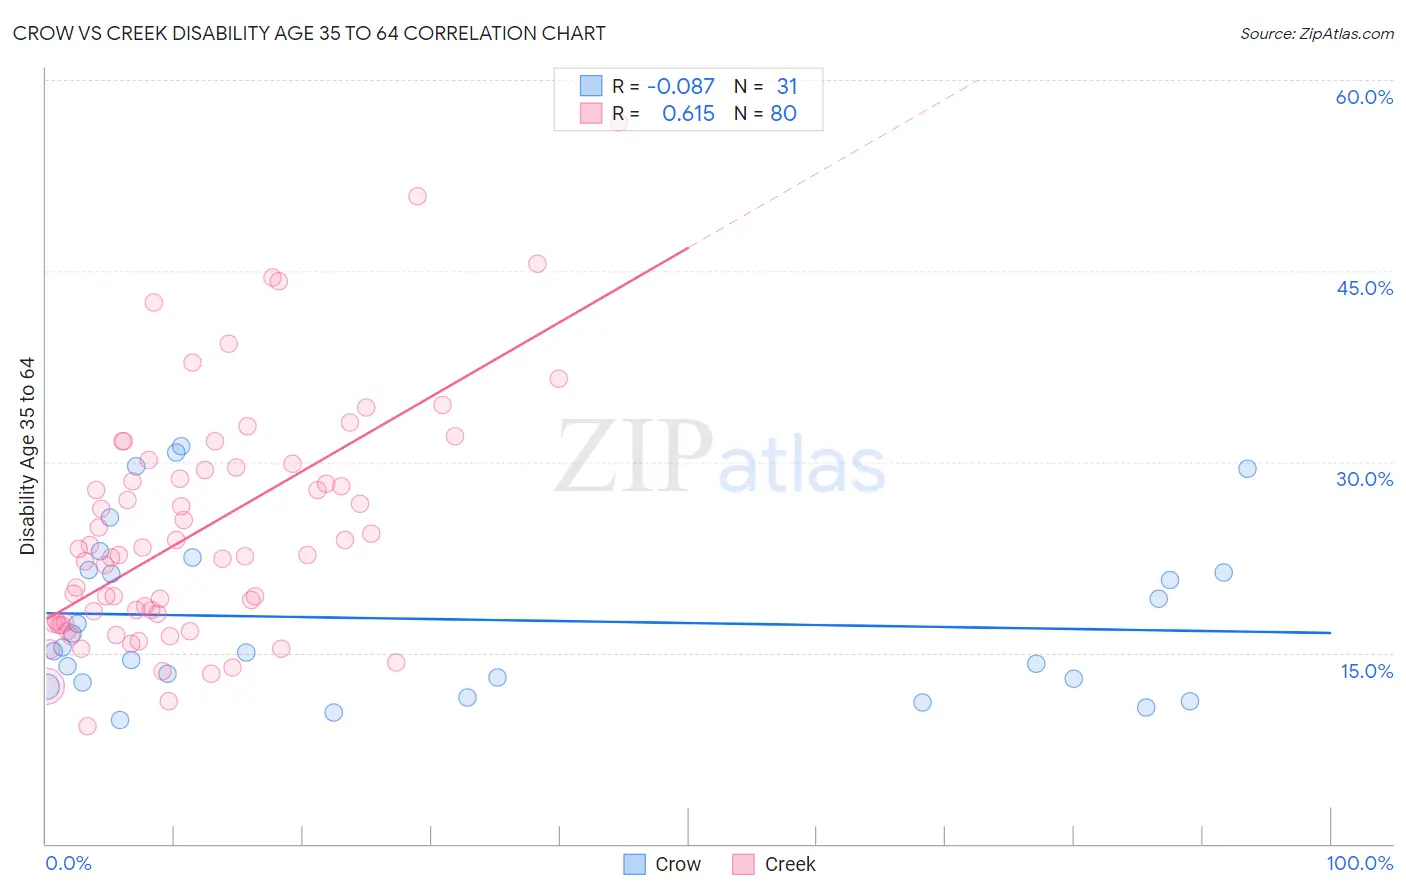
Crow vs Creek Disability Age 35 to 64 Correlation Chart
The statistical analysis conducted on geographies consisting of 59,202,172 people shows a slight negative correlation between the proportion of Crow and percentage of population with a disability between the ages 34 and 64 in the United States with a correlation coefficient (R) of -0.087 and weighted average of 14.6%. Similarly, the statistical analysis conducted on geographies consisting of 178,427,541 people shows a significant positive correlation between the proportion of Creek and percentage of population with a disability between the ages 34 and 64 in the United States with a correlation coefficient (R) of 0.615 and weighted average of 16.9%, a difference of 15.5%.
Disability Age 35 to 64 Correlation Summary
| Measurement | Crow | Creek |
| Minimum | 9.7% | 9.2% |
| Maximum | 31.2% | 56.7% |
| Range | 21.5% | 47.4% |
| Mean | 17.6% | 24.6% |
| Median | 15.1% | 22.7% |
| Interquartile 25% (IQ1) | 12.6% | 17.4% |
| Interquartile 75% (IQ3) | 21.5% | 29.5% |
| Interquartile Range (IQR) | 8.9% | 12.1% |
| Standard Deviation (Sample) | 6.5% | 9.4% |
| Standard Deviation (Population) | 6.4% | 9.3% |
Similar Demographics by Disability Age 35 to 64
Demographics Similar to Crow by Disability Age 35 to 64
In terms of disability age 35 to 64, the demographic groups most similar to Crow are Ottawa (14.6%, a difference of 0.070%), Immigrants from Cabo Verde (14.7%, a difference of 0.49%), Black/African American (14.7%, a difference of 0.64%), Osage (14.5%, a difference of 0.87%), and Comanche (14.7%, a difference of 0.90%).
| Demographics | Rating | Rank | Disability Age 35 to 64 |
| Cape Verdeans | 0.0 /100 | #310 | Tragic 14.1% |
| Immigrants | Azores | 0.0 /100 | #311 | Tragic 14.3% |
| Paiute | 0.0 /100 | #312 | Tragic 14.3% |
| Iroquois | 0.0 /100 | #313 | Tragic 14.4% |
| Shoshone | 0.0 /100 | #314 | Tragic 14.5% |
| Alaska Natives | 0.0 /100 | #315 | Tragic 14.5% |
| Osage | 0.0 /100 | #316 | Tragic 14.5% |
| Crow | 0.0 /100 | #317 | Tragic 14.6% |
| Ottawa | 0.0 /100 | #318 | Tragic 14.6% |
| Immigrants | Cabo Verde | 0.0 /100 | #319 | Tragic 14.7% |
| Blacks/African Americans | 0.0 /100 | #320 | Tragic 14.7% |
| Comanche | 0.0 /100 | #321 | Tragic 14.7% |
| Potawatomi | 0.0 /100 | #322 | Tragic 14.8% |
| Apache | 0.0 /100 | #323 | Tragic 14.9% |
| Chippewa | 0.0 /100 | #324 | Tragic 15.0% |
Demographics Similar to Creek by Disability Age 35 to 64
In terms of disability age 35 to 64, the demographic groups most similar to Creek are Yup'ik (16.9%, a difference of 0.32%), Tohono O'odham (16.7%, a difference of 0.86%), Tsimshian (16.7%, a difference of 0.97%), Kiowa (17.4%, a difference of 2.8%), and Choctaw (16.4%, a difference of 2.9%).
| Demographics | Rating | Rank | Disability Age 35 to 64 |
| Yuman | 0.0 /100 | #333 | Tragic 15.8% |
| Colville | 0.0 /100 | #334 | Tragic 15.8% |
| Seminole | 0.0 /100 | #335 | Tragic 15.9% |
| Menominee | 0.0 /100 | #336 | Tragic 15.9% |
| Puerto Ricans | 0.0 /100 | #337 | Tragic 15.9% |
| Chickasaw | 0.0 /100 | #338 | Tragic 16.1% |
| Pima | 0.0 /100 | #339 | Tragic 16.1% |
| Choctaw | 0.0 /100 | #340 | Tragic 16.4% |
| Tsimshian | 0.0 /100 | #341 | Tragic 16.7% |
| Tohono O'odham | 0.0 /100 | #342 | Tragic 16.7% |
| Creek | 0.0 /100 | #343 | Tragic 16.9% |
| Yup'ik | 0.0 /100 | #344 | Tragic 16.9% |
| Kiowa | 0.0 /100 | #345 | Tragic 17.4% |
| Lumbee | 0.0 /100 | #346 | Tragic 17.6% |
| Houma | 0.0 /100 | #347 | Tragic 18.7% |