Danish vs Immigrants from Canada Disability Age 5 to 17
COMPARE
Danish
Immigrants from Canada
Disability Age 5 to 17
Disability Age 5 to 17 Comparison
Danes
Immigrants from Canada
5.7%
DISABILITY AGE 5 TO 17
26.5/ 100
METRIC RATING
191st/ 347
METRIC RANK
5.7%
DISABILITY AGE 5 TO 17
26.1/ 100
METRIC RATING
193rd/ 347
METRIC RANK
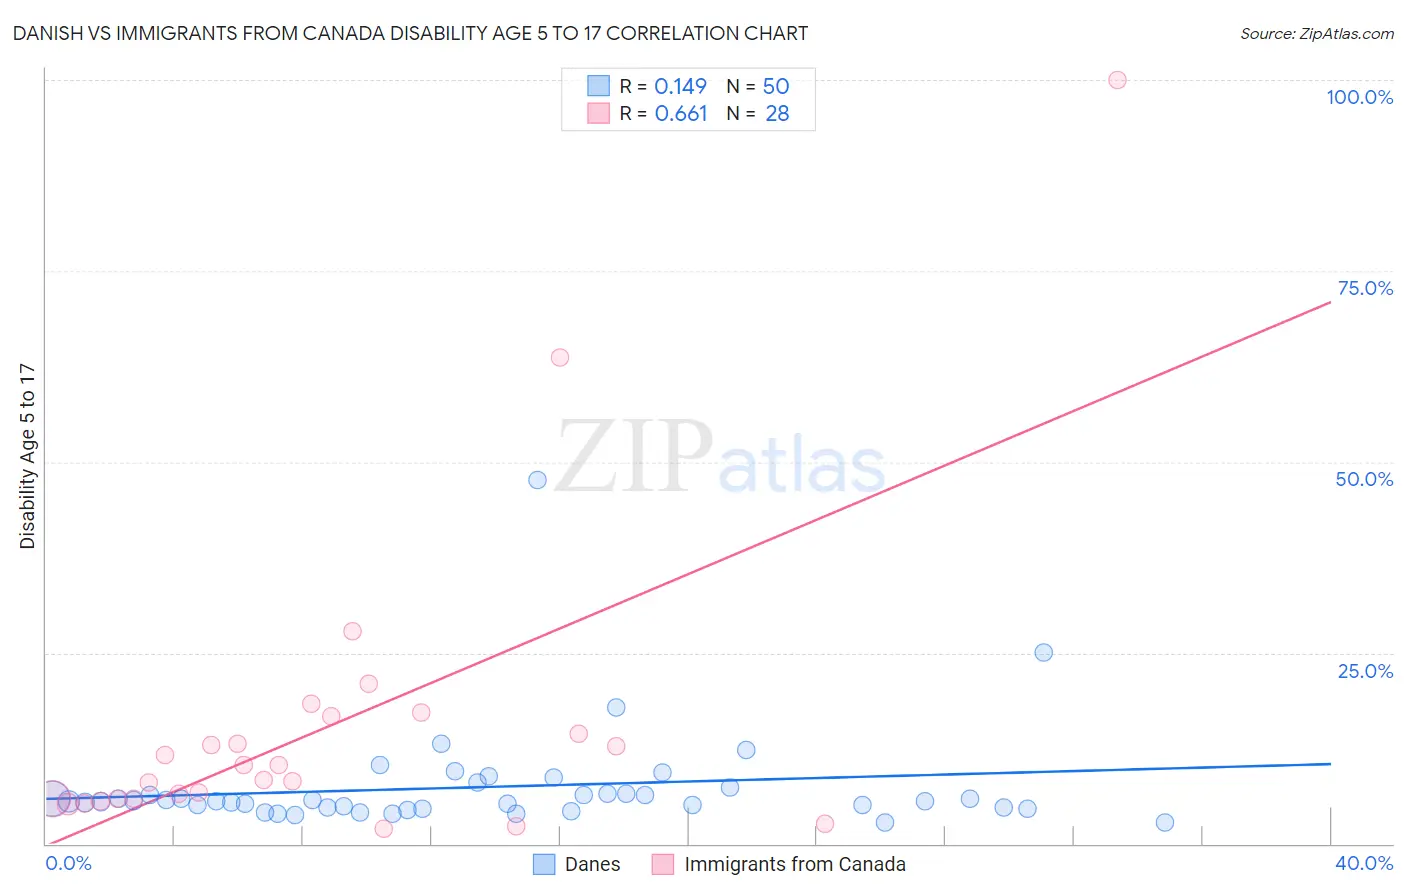
Danish vs Immigrants from Canada Disability Age 5 to 17 Correlation Chart
The statistical analysis conducted on geographies consisting of 467,230,380 people shows a poor positive correlation between the proportion of Danes and percentage of population with a disability between the ages 5 and 17 in the United States with a correlation coefficient (R) of 0.149 and weighted average of 5.7%. Similarly, the statistical analysis conducted on geographies consisting of 453,688,355 people shows a significant positive correlation between the proportion of Immigrants from Canada and percentage of population with a disability between the ages 5 and 17 in the United States with a correlation coefficient (R) of 0.661 and weighted average of 5.7%, a difference of 0.030%.
Disability Age 5 to 17 Correlation Summary
| Measurement | Danish | Immigrants from Canada |
| Minimum | 2.8% | 1.9% |
| Maximum | 47.6% | 100.0% |
| Range | 44.8% | 98.1% |
| Mean | 7.4% | 15.3% |
| Median | 5.6% | 9.3% |
| Interquartile 25% (IQ1) | 4.7% | 5.9% |
| Interquartile 75% (IQ3) | 6.6% | 15.6% |
| Interquartile Range (IQR) | 1.9% | 9.7% |
| Standard Deviation (Sample) | 6.9% | 20.3% |
| Standard Deviation (Population) | 6.9% | 20.0% |
Demographics Similar to Danes and Immigrants from Canada by Disability Age 5 to 17
In terms of disability age 5 to 17, the demographic groups most similar to Danes are Immigrants from Bosnia and Herzegovina (5.7%, a difference of 0.010%), Immigrants from Eastern Africa (5.7%, a difference of 0.050%), Pueblo (5.7%, a difference of 0.060%), Marshallese (5.7%, a difference of 0.10%), and Croatian (5.7%, a difference of 0.19%). Similarly, the demographic groups most similar to Immigrants from Canada are Immigrants from Bosnia and Herzegovina (5.7%, a difference of 0.010%), Immigrants from Eastern Africa (5.7%, a difference of 0.080%), Pueblo (5.7%, a difference of 0.090%), Marshallese (5.7%, a difference of 0.13%), and Croatian (5.7%, a difference of 0.16%).
| Demographics | Rating | Rank | Disability Age 5 to 17 |
| Mexican American Indians | 35.2 /100 | #182 | Fair 5.6% |
| Immigrants | Latin America | 34.3 /100 | #183 | Fair 5.6% |
| Syrians | 33.8 /100 | #184 | Fair 5.6% |
| Immigrants | Mexico | 33.7 /100 | #185 | Fair 5.6% |
| Fijians | 31.7 /100 | #186 | Fair 5.7% |
| Immigrants | Thailand | 30.2 /100 | #187 | Fair 5.7% |
| Marshallese | 28.1 /100 | #188 | Fair 5.7% |
| Pueblo | 27.5 /100 | #189 | Fair 5.7% |
| Immigrants | Eastern Africa | 27.3 /100 | #190 | Fair 5.7% |
| Danes | 26.5 /100 | #191 | Fair 5.7% |
| Immigrants | Bosnia and Herzegovina | 26.3 /100 | #192 | Fair 5.7% |
| Immigrants | Canada | 26.1 /100 | #193 | Fair 5.7% |
| Croatians | 23.6 /100 | #194 | Fair 5.7% |
| Immigrants | Nigeria | 23.4 /100 | #195 | Fair 5.7% |
| Inupiat | 23.3 /100 | #196 | Fair 5.7% |
| Immigrants | North America | 23.1 /100 | #197 | Fair 5.7% |
| Norwegians | 20.9 /100 | #198 | Fair 5.7% |
| Northern Europeans | 15.2 /100 | #199 | Poor 5.7% |
| Icelanders | 14.6 /100 | #200 | Poor 5.7% |
| Basques | 13.7 /100 | #201 | Poor 5.7% |
| Austrians | 13.2 /100 | #202 | Poor 5.7% |