Immigrants from St. Vincent and the Grenadines vs Immigrants from Armenia Disability Age 5 to 17
COMPARE
Immigrants from St. Vincent and the Grenadines
Immigrants from Armenia
Disability Age 5 to 17
Disability Age 5 to 17 Comparison
Immigrants from St. Vincent and the Grenadines
Immigrants from Armenia
5.2%
DISABILITY AGE 5 TO 17
99.4/ 100
METRIC RATING
86th/ 347
METRIC RANK
4.1%
DISABILITY AGE 5 TO 17
100.0/ 100
METRIC RATING
1st/ 347
METRIC RANK
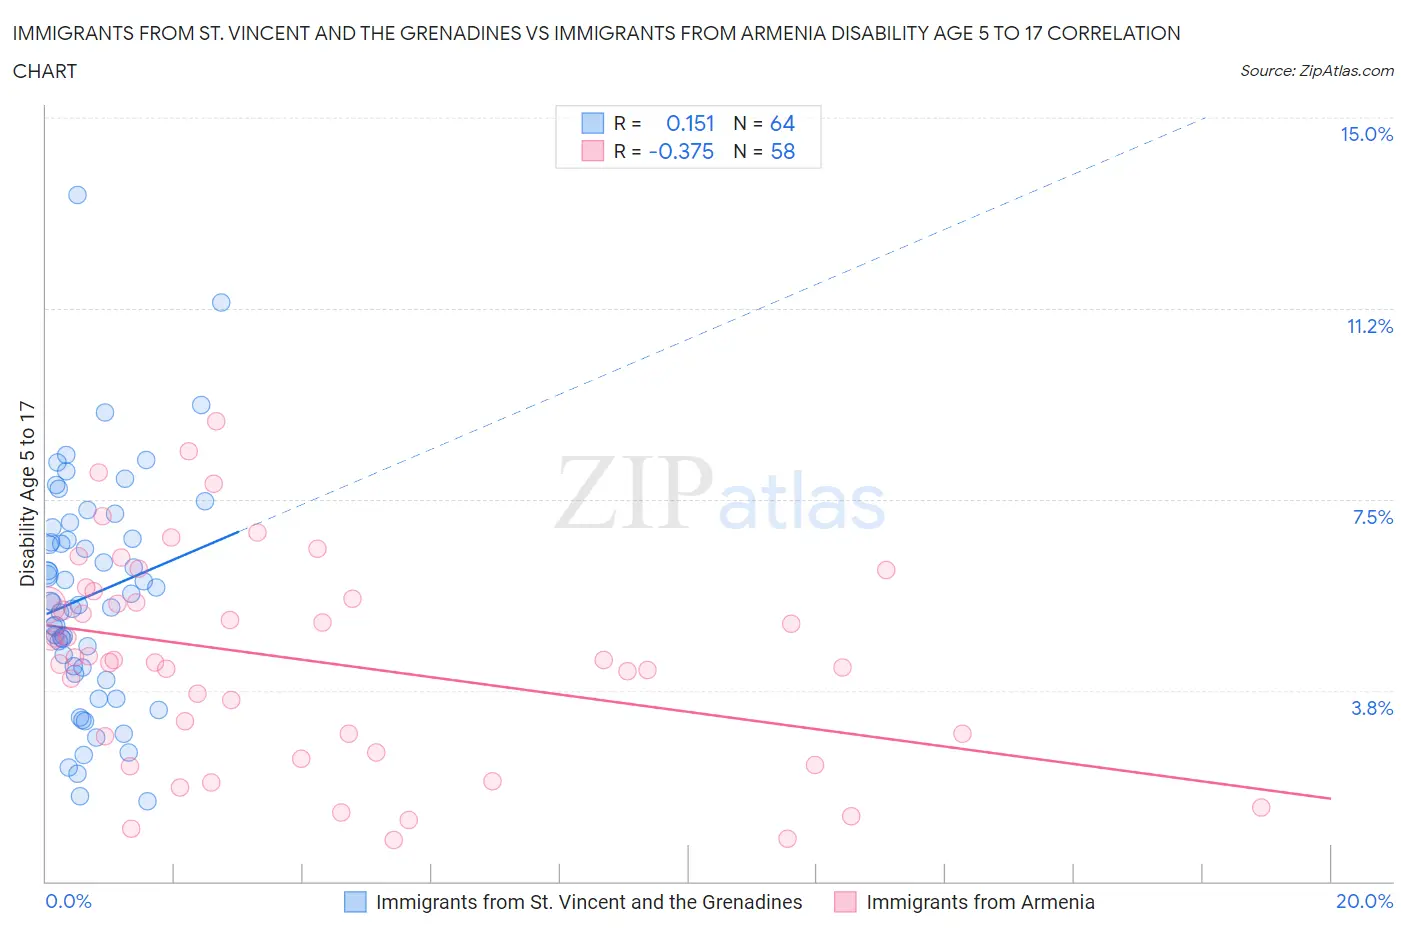
Immigrants from St. Vincent and the Grenadines vs Immigrants from Armenia Disability Age 5 to 17 Correlation Chart
The statistical analysis conducted on geographies consisting of 56,117,818 people shows a poor positive correlation between the proportion of Immigrants from St. Vincent and the Grenadines and percentage of population with a disability between the ages 5 and 17 in the United States with a correlation coefficient (R) of 0.151 and weighted average of 5.2%. Similarly, the statistical analysis conducted on geographies consisting of 97,408,018 people shows a mild negative correlation between the proportion of Immigrants from Armenia and percentage of population with a disability between the ages 5 and 17 in the United States with a correlation coefficient (R) of -0.375 and weighted average of 4.1%, a difference of 29.4%.
Disability Age 5 to 17 Correlation Summary
| Measurement | Immigrants from St. Vincent and the Grenadines | Immigrants from Armenia |
| Minimum | 1.6% | 0.81% |
| Maximum | 13.5% | 9.0% |
| Range | 11.9% | 8.2% |
| Mean | 5.6% | 4.3% |
| Median | 5.5% | 4.3% |
| Interquartile 25% (IQ1) | 4.1% | 2.8% |
| Interquartile 75% (IQ3) | 6.8% | 5.5% |
| Interquartile Range (IQR) | 2.7% | 2.7% |
| Standard Deviation (Sample) | 2.3% | 2.0% |
| Standard Deviation (Population) | 2.2% | 2.0% |
Similar Demographics by Disability Age 5 to 17
Demographics Similar to Immigrants from St. Vincent and the Grenadines by Disability Age 5 to 17
In terms of disability age 5 to 17, the demographic groups most similar to Immigrants from St. Vincent and the Grenadines are Bulgarian (5.2%, a difference of 0.040%), Eastern European (5.2%, a difference of 0.040%), Immigrants from Croatia (5.2%, a difference of 0.070%), Immigrants from Spain (5.2%, a difference of 0.080%), and Immigrants from Nicaragua (5.2%, a difference of 0.11%).
| Demographics | Rating | Rank | Disability Age 5 to 17 |
| Afghans | 99.6 /100 | #79 | Exceptional 5.2% |
| Sri Lankans | 99.6 /100 | #80 | Exceptional 5.2% |
| Native Hawaiians | 99.6 /100 | #81 | Exceptional 5.2% |
| Immigrants | Sweden | 99.5 /100 | #82 | Exceptional 5.2% |
| Immigrants | France | 99.5 /100 | #83 | Exceptional 5.2% |
| Immigrants | Nicaragua | 99.5 /100 | #84 | Exceptional 5.2% |
| Bulgarians | 99.4 /100 | #85 | Exceptional 5.2% |
| Immigrants | St. Vincent and the Grenadines | 99.4 /100 | #86 | Exceptional 5.2% |
| Eastern Europeans | 99.4 /100 | #87 | Exceptional 5.2% |
| Immigrants | Croatia | 99.4 /100 | #88 | Exceptional 5.2% |
| Immigrants | Spain | 99.4 /100 | #89 | Exceptional 5.2% |
| Immigrants | Kuwait | 99.4 /100 | #90 | Exceptional 5.3% |
| Mongolians | 99.2 /100 | #91 | Exceptional 5.3% |
| Luxembourgers | 99.2 /100 | #92 | Exceptional 5.3% |
| Immigrants | Peru | 99.1 /100 | #93 | Exceptional 5.3% |
Demographics Similar to Immigrants from Armenia by Disability Age 5 to 17
In terms of disability age 5 to 17, the demographic groups most similar to Immigrants from Armenia are Immigrants from Taiwan (4.2%, a difference of 3.4%), Immigrants from Hong Kong (4.3%, a difference of 6.0%), Filipino (4.3%, a difference of 7.1%), Immigrants from Iran (4.4%, a difference of 7.7%), and Immigrants from Israel (4.5%, a difference of 11.3%).
| Demographics | Rating | Rank | Disability Age 5 to 17 |
| Immigrants | Armenia | 100.0 /100 | #1 | Exceptional 4.1% |
| Immigrants | Taiwan | 100.0 /100 | #2 | Exceptional 4.2% |
| Immigrants | Hong Kong | 100.0 /100 | #3 | Exceptional 4.3% |
| Filipinos | 100.0 /100 | #4 | Exceptional 4.3% |
| Immigrants | Iran | 100.0 /100 | #5 | Exceptional 4.4% |
| Immigrants | Israel | 100.0 /100 | #6 | Exceptional 4.5% |
| Immigrants | China | 100.0 /100 | #7 | Exceptional 4.5% |
| Indians (Asian) | 100.0 /100 | #8 | Exceptional 4.6% |
| Immigrants | Eastern Asia | 100.0 /100 | #9 | Exceptional 4.6% |
| Immigrants | India | 100.0 /100 | #10 | Exceptional 4.6% |
| Armenians | 100.0 /100 | #11 | Exceptional 4.6% |
| Iranians | 100.0 /100 | #12 | Exceptional 4.6% |
| Thais | 100.0 /100 | #13 | Exceptional 4.7% |
| Immigrants | Korea | 100.0 /100 | #14 | Exceptional 4.7% |
| Chinese | 100.0 /100 | #15 | Exceptional 4.7% |