Immigrants from St. Vincent and the Grenadines vs Mexican Disability Age 5 to 17
COMPARE
Immigrants from St. Vincent and the Grenadines
Mexican
Disability Age 5 to 17
Disability Age 5 to 17 Comparison
Immigrants from St. Vincent and the Grenadines
Mexicans
5.2%
DISABILITY AGE 5 TO 17
99.4/ 100
METRIC RATING
86th/ 347
METRIC RANK
5.8%
DISABILITY AGE 5 TO 17
5.7/ 100
METRIC RATING
224th/ 347
METRIC RANK
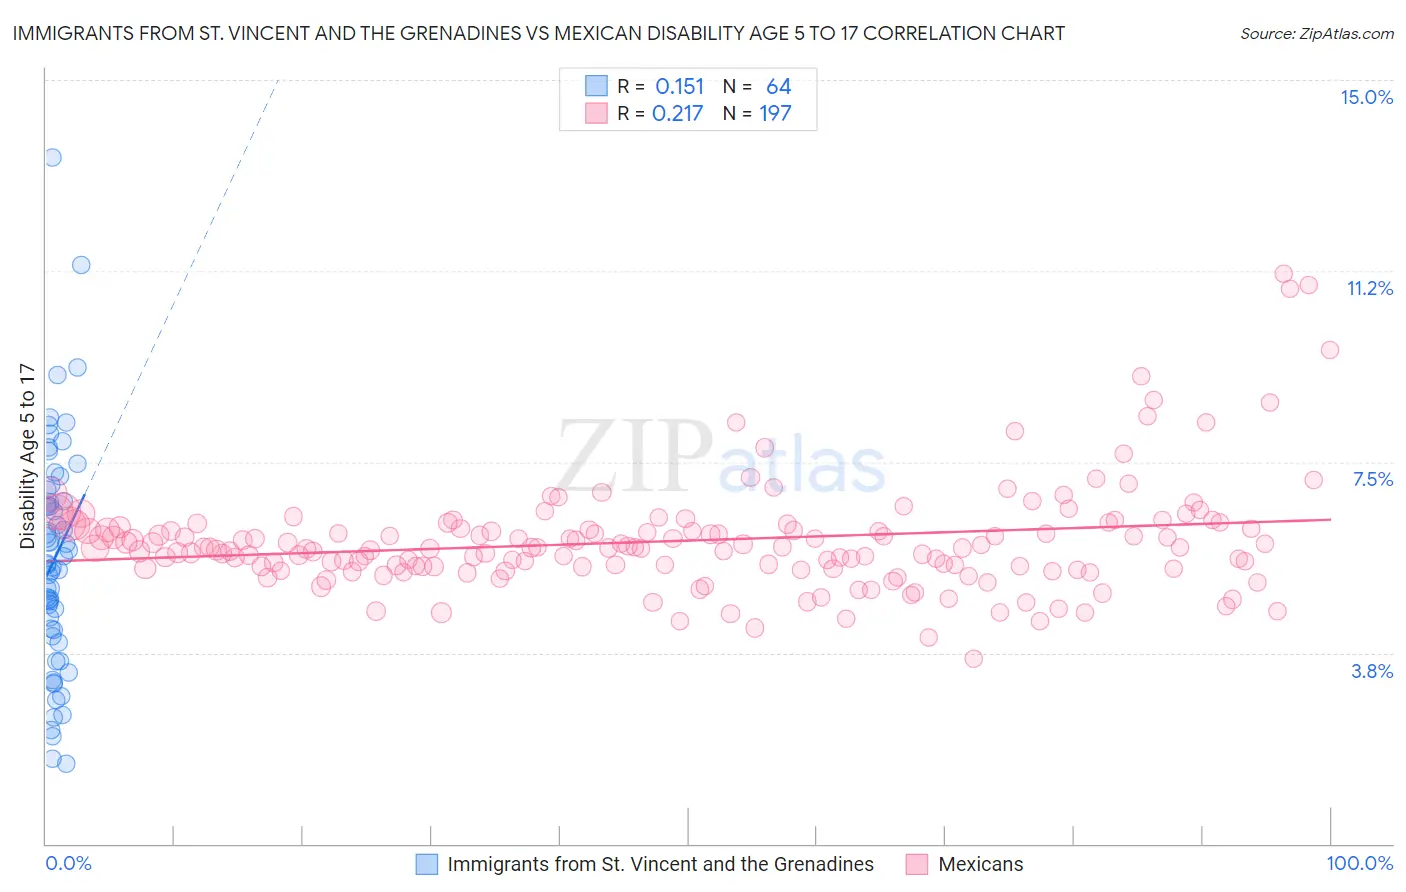
Immigrants from St. Vincent and the Grenadines vs Mexican Disability Age 5 to 17 Correlation Chart
The statistical analysis conducted on geographies consisting of 56,117,818 people shows a poor positive correlation between the proportion of Immigrants from St. Vincent and the Grenadines and percentage of population with a disability between the ages 5 and 17 in the United States with a correlation coefficient (R) of 0.151 and weighted average of 5.2%. Similarly, the statistical analysis conducted on geographies consisting of 553,305,594 people shows a weak positive correlation between the proportion of Mexicans and percentage of population with a disability between the ages 5 and 17 in the United States with a correlation coefficient (R) of 0.217 and weighted average of 5.8%, a difference of 10.5%.
Disability Age 5 to 17 Correlation Summary
| Measurement | Immigrants from St. Vincent and the Grenadines | Mexican |
| Minimum | 1.6% | 3.6% |
| Maximum | 13.5% | 11.2% |
| Range | 11.9% | 7.6% |
| Mean | 5.6% | 5.9% |
| Median | 5.5% | 5.8% |
| Interquartile 25% (IQ1) | 4.1% | 5.4% |
| Interquartile 75% (IQ3) | 6.8% | 6.2% |
| Interquartile Range (IQR) | 2.7% | 0.78% |
| Standard Deviation (Sample) | 2.3% | 1.1% |
| Standard Deviation (Population) | 2.2% | 1.1% |
Similar Demographics by Disability Age 5 to 17
Demographics Similar to Immigrants from St. Vincent and the Grenadines by Disability Age 5 to 17
In terms of disability age 5 to 17, the demographic groups most similar to Immigrants from St. Vincent and the Grenadines are Bulgarian (5.2%, a difference of 0.040%), Eastern European (5.2%, a difference of 0.040%), Immigrants from Croatia (5.2%, a difference of 0.070%), Immigrants from Spain (5.2%, a difference of 0.080%), and Immigrants from Nicaragua (5.2%, a difference of 0.11%).
| Demographics | Rating | Rank | Disability Age 5 to 17 |
| Afghans | 99.6 /100 | #79 | Exceptional 5.2% |
| Sri Lankans | 99.6 /100 | #80 | Exceptional 5.2% |
| Native Hawaiians | 99.6 /100 | #81 | Exceptional 5.2% |
| Immigrants | Sweden | 99.5 /100 | #82 | Exceptional 5.2% |
| Immigrants | France | 99.5 /100 | #83 | Exceptional 5.2% |
| Immigrants | Nicaragua | 99.5 /100 | #84 | Exceptional 5.2% |
| Bulgarians | 99.4 /100 | #85 | Exceptional 5.2% |
| Immigrants | St. Vincent and the Grenadines | 99.4 /100 | #86 | Exceptional 5.2% |
| Eastern Europeans | 99.4 /100 | #87 | Exceptional 5.2% |
| Immigrants | Croatia | 99.4 /100 | #88 | Exceptional 5.2% |
| Immigrants | Spain | 99.4 /100 | #89 | Exceptional 5.2% |
| Immigrants | Kuwait | 99.4 /100 | #90 | Exceptional 5.3% |
| Mongolians | 99.2 /100 | #91 | Exceptional 5.3% |
| Luxembourgers | 99.2 /100 | #92 | Exceptional 5.3% |
| Immigrants | Peru | 99.1 /100 | #93 | Exceptional 5.3% |
Demographics Similar to Mexicans by Disability Age 5 to 17
In terms of disability age 5 to 17, the demographic groups most similar to Mexicans are Guamanian/Chamorro (5.8%, a difference of 0.020%), Alsatian (5.8%, a difference of 0.060%), British West Indian (5.8%, a difference of 0.060%), Swiss (5.8%, a difference of 0.14%), and Lithuanian (5.8%, a difference of 0.21%).
| Demographics | Rating | Rank | Disability Age 5 to 17 |
| Czechs | 7.4 /100 | #217 | Tragic 5.8% |
| Immigrants | Sierra Leone | 7.1 /100 | #218 | Tragic 5.8% |
| Sierra Leoneans | 7.0 /100 | #219 | Tragic 5.8% |
| Belgians | 6.9 /100 | #220 | Tragic 5.8% |
| Lithuanians | 6.7 /100 | #221 | Tragic 5.8% |
| Immigrants | Sudan | 6.7 /100 | #222 | Tragic 5.8% |
| Alsatians | 6.0 /100 | #223 | Tragic 5.8% |
| Mexicans | 5.7 /100 | #224 | Tragic 5.8% |
| Guamanians/Chamorros | 5.6 /100 | #225 | Tragic 5.8% |
| British West Indians | 5.4 /100 | #226 | Tragic 5.8% |
| Swiss | 5.1 /100 | #227 | Tragic 5.8% |
| Haitians | 4.8 /100 | #228 | Tragic 5.8% |
| Bangladeshis | 4.8 /100 | #229 | Tragic 5.8% |
| Ghanaians | 4.7 /100 | #230 | Tragic 5.8% |
| Europeans | 4.5 /100 | #231 | Tragic 5.8% |