Immigrants from St. Vincent and the Grenadines vs Immigrants from Armenia Family Households with Children
COMPARE
Immigrants from St. Vincent and the Grenadines
Immigrants from Armenia
Family Households with Children
Family Households with Children Comparison
Immigrants from St. Vincent and the Grenadines
Immigrants from Armenia
25.6%
FAMILY HOUSEHOLDS WITH CHILDREN
0.0/ 100
METRIC RATING
339th/ 347
METRIC RANK
25.6%
FAMILY HOUSEHOLDS WITH CHILDREN
0.0/ 100
METRIC RATING
340th/ 347
METRIC RANK
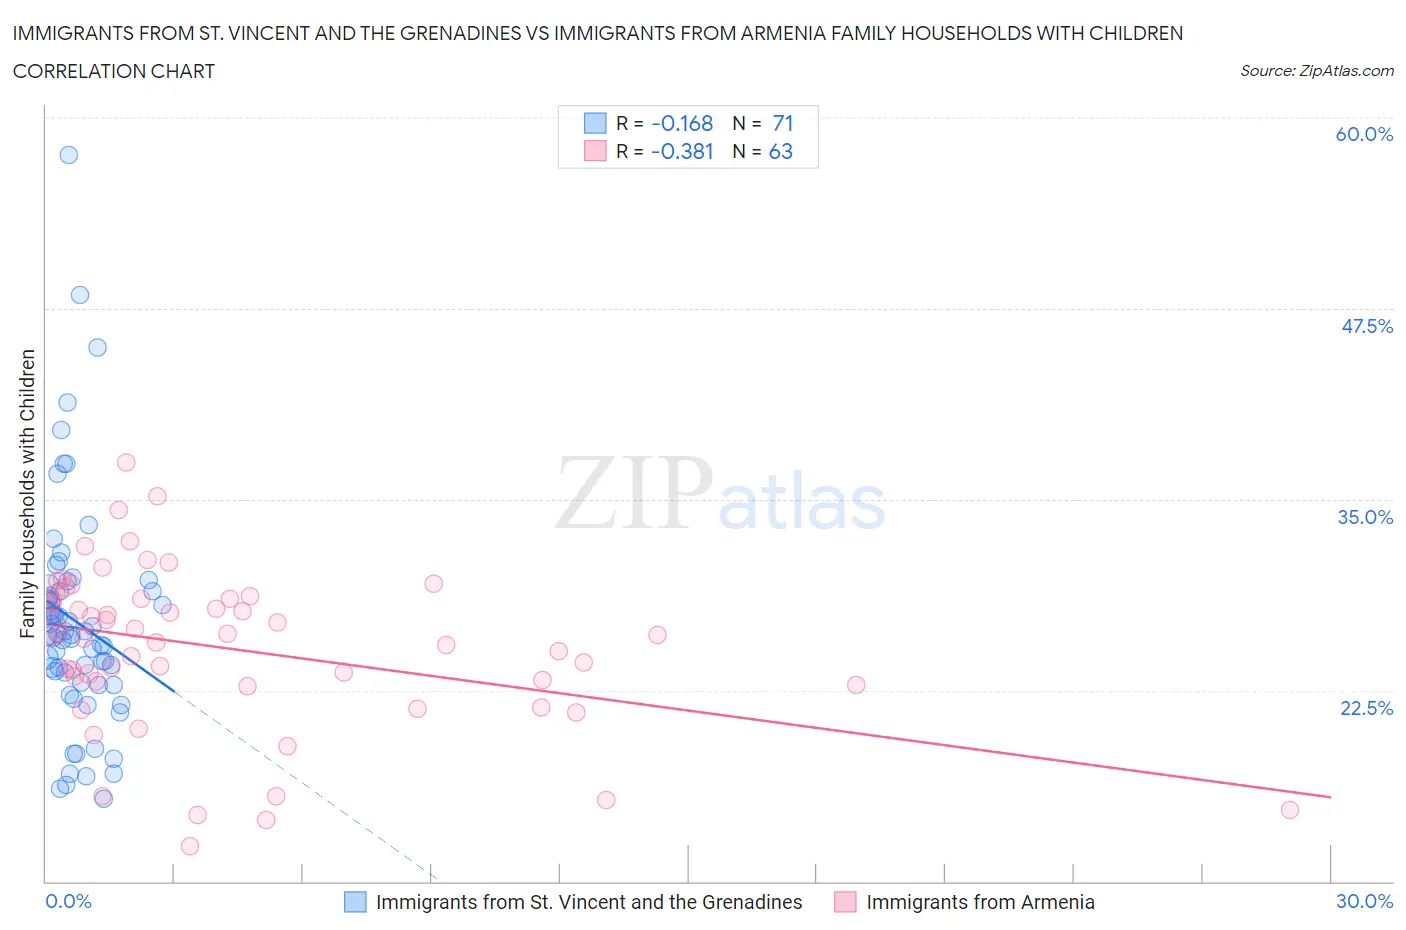
Immigrants from St. Vincent and the Grenadines vs Immigrants from Armenia Family Households with Children Correlation Chart
The statistical analysis conducted on geographies consisting of 56,180,782 people shows a poor negative correlation between the proportion of Immigrants from St. Vincent and the Grenadines and percentage of family households with children in the United States with a correlation coefficient (R) of -0.168 and weighted average of 25.6%. Similarly, the statistical analysis conducted on geographies consisting of 97,683,198 people shows a mild negative correlation between the proportion of Immigrants from Armenia and percentage of family households with children in the United States with a correlation coefficient (R) of -0.381 and weighted average of 25.6%, a difference of 0.040%.
Family Households with Children Correlation Summary
| Measurement | Immigrants from St. Vincent and the Grenadines | Immigrants from Armenia |
| Minimum | 15.4% | 12.3% |
| Maximum | 57.6% | 37.4% |
| Range | 42.2% | 25.2% |
| Mean | 27.0% | 25.2% |
| Median | 26.1% | 26.2% |
| Interquartile 25% (IQ1) | 23.0% | 22.8% |
| Interquartile 75% (IQ3) | 29.0% | 28.5% |
| Interquartile Range (IQR) | 6.0% | 5.7% |
| Standard Deviation (Sample) | 7.4% | 5.3% |
| Standard Deviation (Population) | 7.3% | 5.2% |
Demographics Similar to Immigrants from St. Vincent and the Grenadines and Immigrants from Armenia by Family Households with Children
In terms of family households with children, the demographic groups most similar to Immigrants from St. Vincent and the Grenadines are Arapaho (25.6%, a difference of 0.010%), Puerto Rican (25.6%, a difference of 0.040%), Immigrants from Serbia (25.5%, a difference of 0.42%), Immigrants from West Indies (25.7%, a difference of 0.43%), and Immigrants from Croatia (25.7%, a difference of 0.52%). Similarly, the demographic groups most similar to Immigrants from Armenia are Arapaho (25.6%, a difference of 0.050%), Puerto Rican (25.6%, a difference of 0.080%), Immigrants from Serbia (25.5%, a difference of 0.38%), Immigrants from West Indies (25.7%, a difference of 0.47%), and Immigrants from Croatia (25.7%, a difference of 0.56%).
| Demographics | Rating | Rank | Family Households with Children |
| Immigrants | Albania | 0.0 /100 | #328 | Tragic 25.9% |
| Cypriots | 0.0 /100 | #329 | Tragic 25.9% |
| Immigrants | Latvia | 0.0 /100 | #330 | Tragic 25.9% |
| Slovenes | 0.0 /100 | #331 | Tragic 25.8% |
| Immigrants | Austria | 0.0 /100 | #332 | Tragic 25.8% |
| Immigrants | Switzerland | 0.0 /100 | #333 | Tragic 25.7% |
| Slovaks | 0.0 /100 | #334 | Tragic 25.7% |
| Immigrants | Croatia | 0.0 /100 | #335 | Tragic 25.7% |
| Immigrants | West Indies | 0.0 /100 | #336 | Tragic 25.7% |
| Puerto Ricans | 0.0 /100 | #337 | Tragic 25.6% |
| Arapaho | 0.0 /100 | #338 | Tragic 25.6% |
| Immigrants | St. Vincent and the Grenadines | 0.0 /100 | #339 | Tragic 25.6% |
| Immigrants | Armenia | 0.0 /100 | #340 | Tragic 25.6% |
| Immigrants | Serbia | 0.0 /100 | #341 | Tragic 25.5% |
| Alsatians | 0.0 /100 | #342 | Tragic 25.3% |
| Hopi | 0.0 /100 | #343 | Tragic 25.2% |
| Pueblo | 0.0 /100 | #344 | Tragic 25.2% |
| Immigrants | Grenada | 0.0 /100 | #345 | Tragic 25.2% |
| Carpatho Rusyns | 0.0 /100 | #346 | Tragic 25.2% |
| Soviet Union | 0.0 /100 | #347 | Tragic 24.8% |