Cajun vs Immigrants from Armenia Disability Age 5 to 17
COMPARE
Cajun
Immigrants from Armenia
Disability Age 5 to 17
Disability Age 5 to 17 Comparison
Cajuns
Immigrants from Armenia
7.2%
DISABILITY AGE 5 TO 17
0.0/ 100
METRIC RATING
344th/ 347
METRIC RANK
4.1%
DISABILITY AGE 5 TO 17
100.0/ 100
METRIC RATING
1st/ 347
METRIC RANK
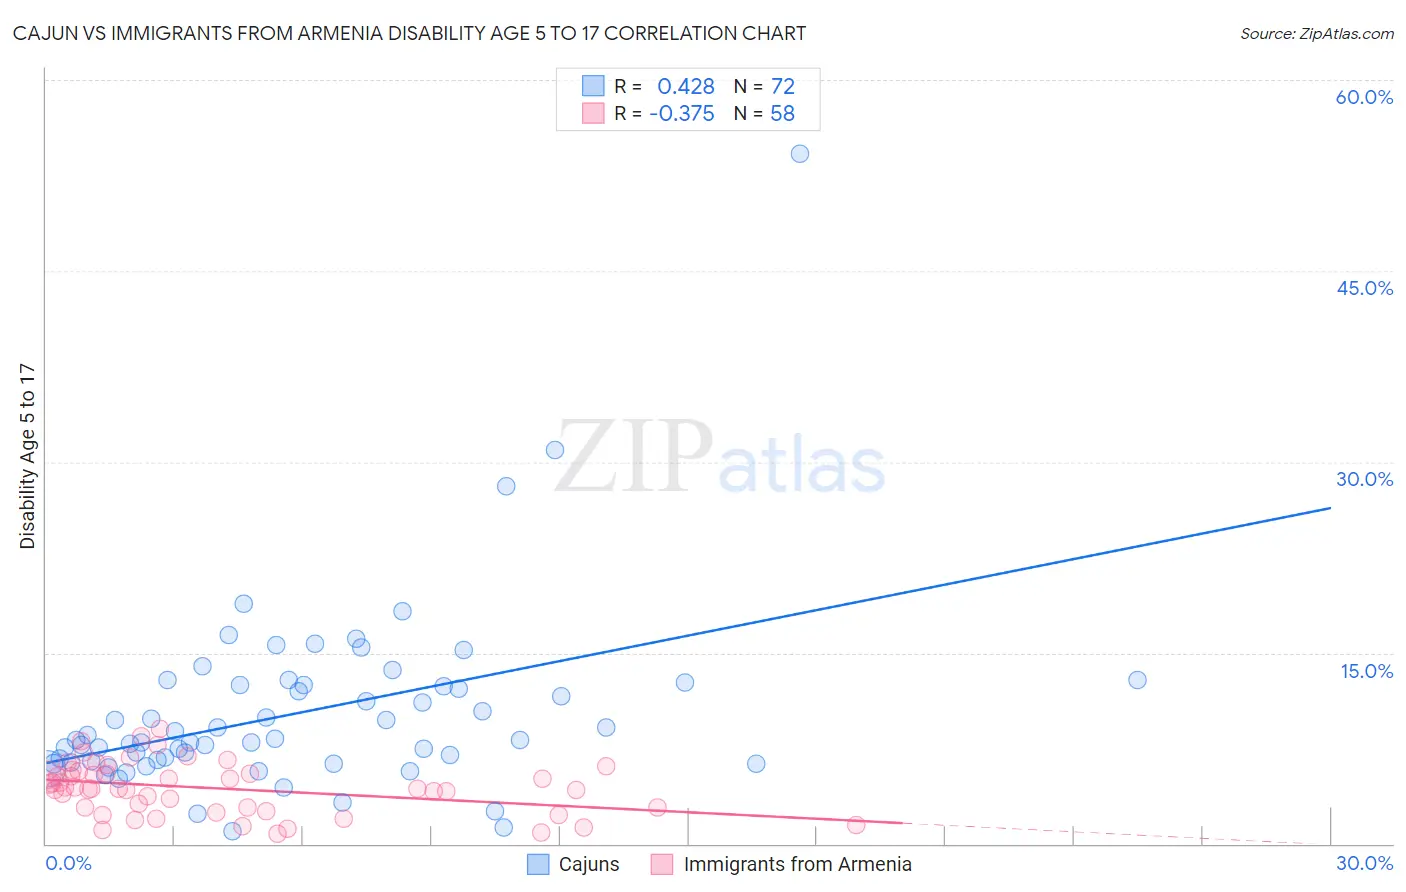
Cajun vs Immigrants from Armenia Disability Age 5 to 17 Correlation Chart
The statistical analysis conducted on geographies consisting of 149,070,842 people shows a moderate positive correlation between the proportion of Cajuns and percentage of population with a disability between the ages 5 and 17 in the United States with a correlation coefficient (R) of 0.428 and weighted average of 7.2%. Similarly, the statistical analysis conducted on geographies consisting of 97,408,018 people shows a mild negative correlation between the proportion of Immigrants from Armenia and percentage of population with a disability between the ages 5 and 17 in the United States with a correlation coefficient (R) of -0.375 and weighted average of 4.1%, a difference of 77.3%.
Disability Age 5 to 17 Correlation Summary
| Measurement | Cajun | Immigrants from Armenia |
| Minimum | 0.98% | 0.81% |
| Maximum | 54.2% | 9.0% |
| Range | 53.2% | 8.2% |
| Mean | 10.3% | 4.3% |
| Median | 8.2% | 4.3% |
| Interquartile 25% (IQ1) | 6.4% | 2.8% |
| Interquartile 75% (IQ3) | 12.5% | 5.5% |
| Interquartile Range (IQR) | 6.1% | 2.7% |
| Standard Deviation (Sample) | 7.4% | 2.0% |
| Standard Deviation (Population) | 7.3% | 2.0% |
Similar Demographics by Disability Age 5 to 17
Demographics Similar to Cajuns by Disability Age 5 to 17
In terms of disability age 5 to 17, the demographic groups most similar to Cajuns are Immigrants from Cabo Verde (7.1%, a difference of 0.70%), Chippewa (7.1%, a difference of 0.96%), Cape Verdean (7.0%, a difference of 3.2%), Cherokee (6.9%, a difference of 3.7%), and Choctaw (6.9%, a difference of 4.0%).
| Demographics | Rating | Rank | Disability Age 5 to 17 |
| Blacks/African Americans | 0.0 /100 | #333 | Tragic 6.8% |
| Seminole | 0.0 /100 | #334 | Tragic 6.8% |
| Ottawa | 0.0 /100 | #335 | Tragic 6.8% |
| Chickasaw | 0.0 /100 | #336 | Tragic 6.8% |
| Creek | 0.0 /100 | #337 | Tragic 6.9% |
| Iroquois | 0.0 /100 | #338 | Tragic 6.9% |
| Choctaw | 0.0 /100 | #339 | Tragic 6.9% |
| Cherokee | 0.0 /100 | #340 | Tragic 6.9% |
| Cape Verdeans | 0.0 /100 | #341 | Tragic 7.0% |
| Chippewa | 0.0 /100 | #342 | Tragic 7.1% |
| Immigrants | Cabo Verde | 0.0 /100 | #343 | Tragic 7.1% |
| Cajuns | 0.0 /100 | #344 | Tragic 7.2% |
| Tsimshian | 0.0 /100 | #345 | Tragic 7.9% |
| Puerto Ricans | 0.0 /100 | #346 | Tragic 8.3% |
| Houma | 0.0 /100 | #347 | Tragic 9.1% |
Demographics Similar to Immigrants from Armenia by Disability Age 5 to 17
In terms of disability age 5 to 17, the demographic groups most similar to Immigrants from Armenia are Immigrants from Taiwan (4.2%, a difference of 3.4%), Immigrants from Hong Kong (4.3%, a difference of 6.0%), Filipino (4.3%, a difference of 7.1%), Immigrants from Iran (4.4%, a difference of 7.7%), and Immigrants from Israel (4.5%, a difference of 11.3%).
| Demographics | Rating | Rank | Disability Age 5 to 17 |
| Immigrants | Armenia | 100.0 /100 | #1 | Exceptional 4.1% |
| Immigrants | Taiwan | 100.0 /100 | #2 | Exceptional 4.2% |
| Immigrants | Hong Kong | 100.0 /100 | #3 | Exceptional 4.3% |
| Filipinos | 100.0 /100 | #4 | Exceptional 4.3% |
| Immigrants | Iran | 100.0 /100 | #5 | Exceptional 4.4% |
| Immigrants | Israel | 100.0 /100 | #6 | Exceptional 4.5% |
| Immigrants | China | 100.0 /100 | #7 | Exceptional 4.5% |
| Indians (Asian) | 100.0 /100 | #8 | Exceptional 4.6% |
| Immigrants | Eastern Asia | 100.0 /100 | #9 | Exceptional 4.6% |
| Immigrants | India | 100.0 /100 | #10 | Exceptional 4.6% |
| Armenians | 100.0 /100 | #11 | Exceptional 4.6% |
| Iranians | 100.0 /100 | #12 | Exceptional 4.6% |
| Thais | 100.0 /100 | #13 | Exceptional 4.7% |
| Immigrants | Korea | 100.0 /100 | #14 | Exceptional 4.7% |
| Chinese | 100.0 /100 | #15 | Exceptional 4.7% |