Immigrants from St. Vincent and the Grenadines vs Russian Disability Age 5 to 17
COMPARE
Immigrants from St. Vincent and the Grenadines
Russian
Disability Age 5 to 17
Disability Age 5 to 17 Comparison
Immigrants from St. Vincent and the Grenadines
Russians
5.2%
DISABILITY AGE 5 TO 17
99.4/ 100
METRIC RATING
86th/ 347
METRIC RANK
5.3%
DISABILITY AGE 5 TO 17
98.2/ 100
METRIC RATING
107th/ 347
METRIC RANK
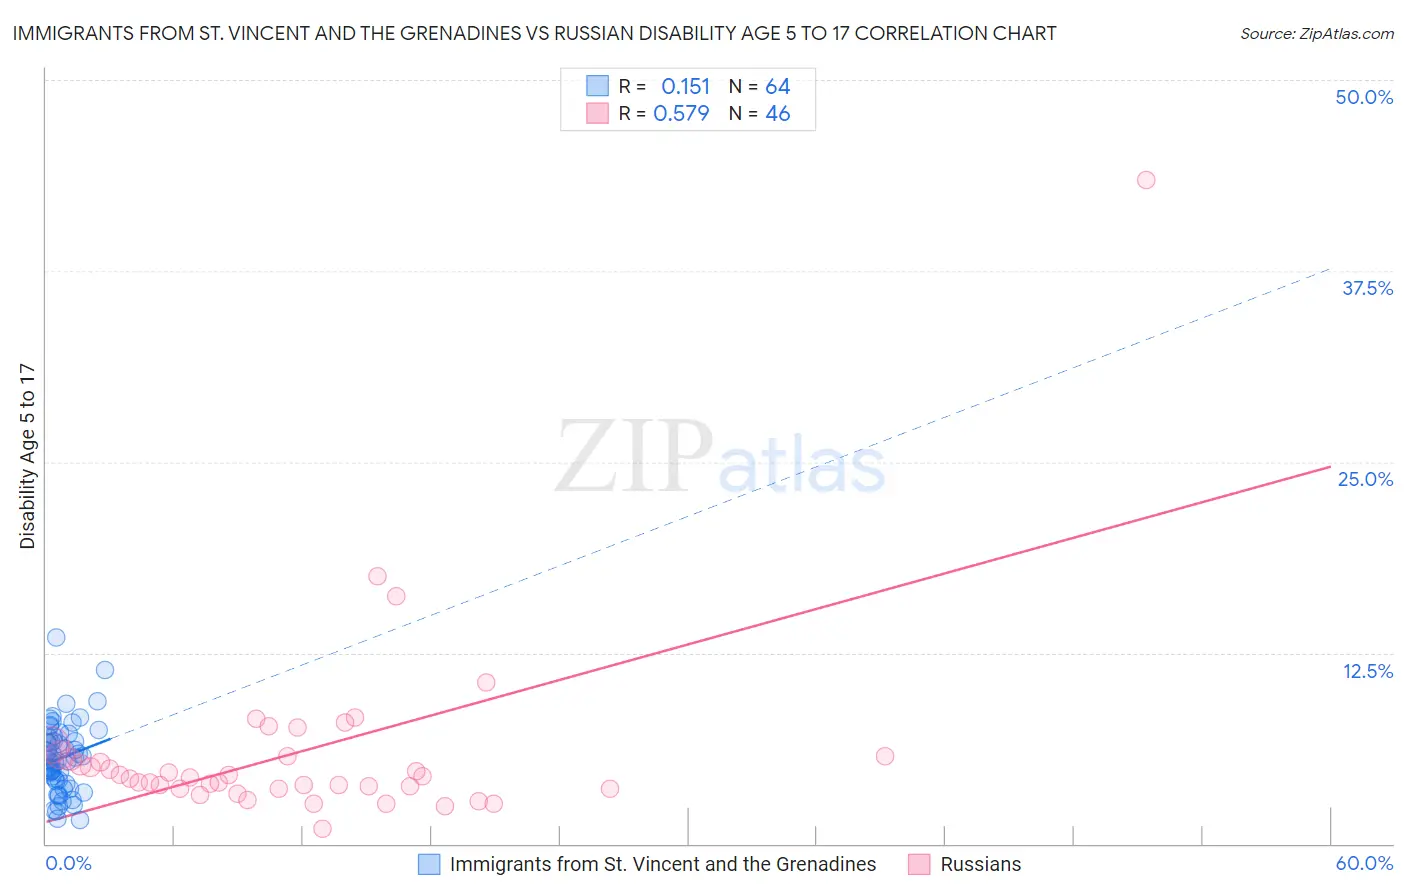
Immigrants from St. Vincent and the Grenadines vs Russian Disability Age 5 to 17 Correlation Chart
The statistical analysis conducted on geographies consisting of 56,117,818 people shows a poor positive correlation between the proportion of Immigrants from St. Vincent and the Grenadines and percentage of population with a disability between the ages 5 and 17 in the United States with a correlation coefficient (R) of 0.151 and weighted average of 5.2%. Similarly, the statistical analysis conducted on geographies consisting of 503,780,510 people shows a substantial positive correlation between the proportion of Russians and percentage of population with a disability between the ages 5 and 17 in the United States with a correlation coefficient (R) of 0.579 and weighted average of 5.3%, a difference of 1.5%.
Disability Age 5 to 17 Correlation Summary
| Measurement | Immigrants from St. Vincent and the Grenadines | Russian |
| Minimum | 1.6% | 0.98% |
| Maximum | 13.5% | 43.5% |
| Range | 11.9% | 42.5% |
| Mean | 5.6% | 6.0% |
| Median | 5.5% | 4.4% |
| Interquartile 25% (IQ1) | 4.1% | 3.6% |
| Interquartile 75% (IQ3) | 6.8% | 5.7% |
| Interquartile Range (IQR) | 2.7% | 2.1% |
| Standard Deviation (Sample) | 2.3% | 6.4% |
| Standard Deviation (Population) | 2.2% | 6.4% |
Similar Demographics by Disability Age 5 to 17
Demographics Similar to Immigrants from St. Vincent and the Grenadines by Disability Age 5 to 17
In terms of disability age 5 to 17, the demographic groups most similar to Immigrants from St. Vincent and the Grenadines are Bulgarian (5.2%, a difference of 0.040%), Eastern European (5.2%, a difference of 0.040%), Immigrants from Croatia (5.2%, a difference of 0.070%), Immigrants from Spain (5.2%, a difference of 0.080%), and Immigrants from Nicaragua (5.2%, a difference of 0.11%).
| Demographics | Rating | Rank | Disability Age 5 to 17 |
| Afghans | 99.6 /100 | #79 | Exceptional 5.2% |
| Sri Lankans | 99.6 /100 | #80 | Exceptional 5.2% |
| Native Hawaiians | 99.6 /100 | #81 | Exceptional 5.2% |
| Immigrants | Sweden | 99.5 /100 | #82 | Exceptional 5.2% |
| Immigrants | France | 99.5 /100 | #83 | Exceptional 5.2% |
| Immigrants | Nicaragua | 99.5 /100 | #84 | Exceptional 5.2% |
| Bulgarians | 99.4 /100 | #85 | Exceptional 5.2% |
| Immigrants | St. Vincent and the Grenadines | 99.4 /100 | #86 | Exceptional 5.2% |
| Eastern Europeans | 99.4 /100 | #87 | Exceptional 5.2% |
| Immigrants | Croatia | 99.4 /100 | #88 | Exceptional 5.2% |
| Immigrants | Spain | 99.4 /100 | #89 | Exceptional 5.2% |
| Immigrants | Kuwait | 99.4 /100 | #90 | Exceptional 5.3% |
| Mongolians | 99.2 /100 | #91 | Exceptional 5.3% |
| Luxembourgers | 99.2 /100 | #92 | Exceptional 5.3% |
| Immigrants | Peru | 99.1 /100 | #93 | Exceptional 5.3% |
Demographics Similar to Russians by Disability Age 5 to 17
In terms of disability age 5 to 17, the demographic groups most similar to Russians are Immigrants from Yemen (5.3%, a difference of 0.030%), Immigrants from South Africa (5.3%, a difference of 0.040%), Immigrants from Northern Africa (5.3%, a difference of 0.080%), Immigrants from Eritrea (5.3%, a difference of 0.12%), and Immigrants from Italy (5.3%, a difference of 0.16%).
| Demographics | Rating | Rank | Disability Age 5 to 17 |
| Nepalese | 98.7 /100 | #100 | Exceptional 5.3% |
| Menominee | 98.7 /100 | #101 | Exceptional 5.3% |
| Nicaraguans | 98.6 /100 | #102 | Exceptional 5.3% |
| Salvadorans | 98.6 /100 | #103 | Exceptional 5.3% |
| Peruvians | 98.5 /100 | #104 | Exceptional 5.3% |
| Immigrants | Italy | 98.4 /100 | #105 | Exceptional 5.3% |
| Immigrants | Yemen | 98.2 /100 | #106 | Exceptional 5.3% |
| Russians | 98.2 /100 | #107 | Exceptional 5.3% |
| Immigrants | South Africa | 98.1 /100 | #108 | Exceptional 5.3% |
| Immigrants | Northern Africa | 98.1 /100 | #109 | Exceptional 5.3% |
| Immigrants | Eritrea | 98.0 /100 | #110 | Exceptional 5.3% |
| Ethiopians | 97.9 /100 | #111 | Exceptional 5.3% |
| Immigrants | Latvia | 97.9 /100 | #112 | Exceptional 5.3% |
| Aleuts | 97.8 /100 | #113 | Exceptional 5.3% |
| Immigrants | Northern Europe | 97.8 /100 | #114 | Exceptional 5.3% |