Immigrants from St. Vincent and the Grenadines vs Immigrants from Western Europe Disability Age 5 to 17
COMPARE
Immigrants from St. Vincent and the Grenadines
Immigrants from Western Europe
Disability Age 5 to 17
Disability Age 5 to 17 Comparison
Immigrants from St. Vincent and the Grenadines
Immigrants from Western Europe
5.2%
DISABILITY AGE 5 TO 17
99.4/ 100
METRIC RATING
86th/ 347
METRIC RANK
5.6%
DISABILITY AGE 5 TO 17
47.8/ 100
METRIC RATING
177th/ 347
METRIC RANK
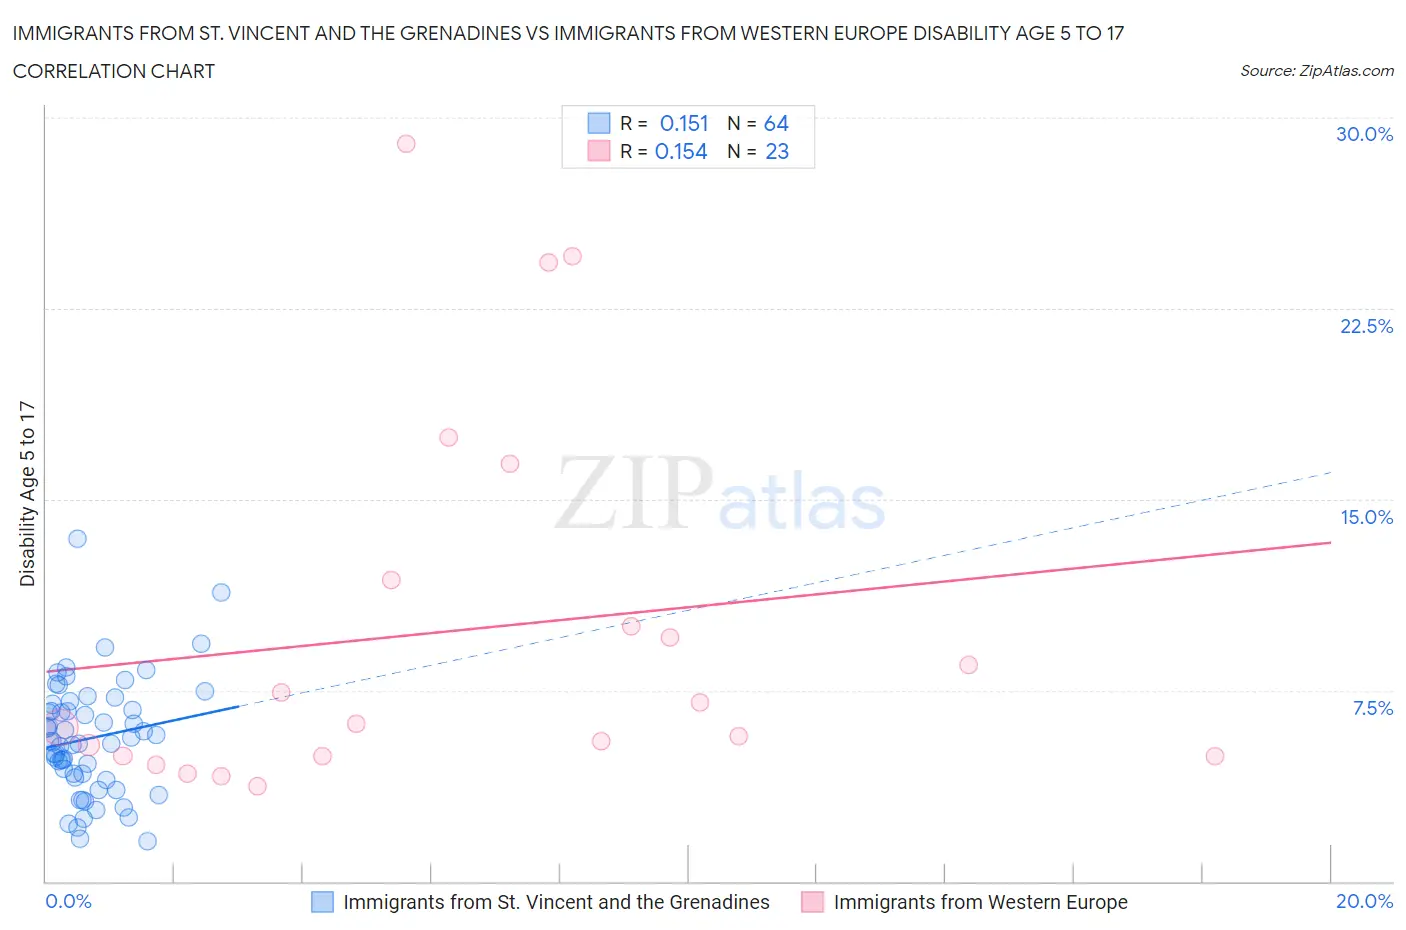
Immigrants from St. Vincent and the Grenadines vs Immigrants from Western Europe Disability Age 5 to 17 Correlation Chart
The statistical analysis conducted on geographies consisting of 56,117,818 people shows a poor positive correlation between the proportion of Immigrants from St. Vincent and the Grenadines and percentage of population with a disability between the ages 5 and 17 in the United States with a correlation coefficient (R) of 0.151 and weighted average of 5.2%. Similarly, the statistical analysis conducted on geographies consisting of 487,296,629 people shows a poor positive correlation between the proportion of Immigrants from Western Europe and percentage of population with a disability between the ages 5 and 17 in the United States with a correlation coefficient (R) of 0.154 and weighted average of 5.6%, a difference of 6.9%.
Disability Age 5 to 17 Correlation Summary
| Measurement | Immigrants from St. Vincent and the Grenadines | Immigrants from Western Europe |
| Minimum | 1.6% | 3.7% |
| Maximum | 13.5% | 29.0% |
| Range | 11.9% | 25.2% |
| Mean | 5.6% | 9.8% |
| Median | 5.5% | 6.2% |
| Interquartile 25% (IQ1) | 4.1% | 4.9% |
| Interquartile 75% (IQ3) | 6.8% | 11.8% |
| Interquartile Range (IQR) | 2.7% | 6.9% |
| Standard Deviation (Sample) | 2.3% | 7.4% |
| Standard Deviation (Population) | 2.2% | 7.2% |
Similar Demographics by Disability Age 5 to 17
Demographics Similar to Immigrants from St. Vincent and the Grenadines by Disability Age 5 to 17
In terms of disability age 5 to 17, the demographic groups most similar to Immigrants from St. Vincent and the Grenadines are Bulgarian (5.2%, a difference of 0.040%), Eastern European (5.2%, a difference of 0.040%), Immigrants from Croatia (5.2%, a difference of 0.070%), Immigrants from Spain (5.2%, a difference of 0.080%), and Immigrants from Nicaragua (5.2%, a difference of 0.11%).
| Demographics | Rating | Rank | Disability Age 5 to 17 |
| Afghans | 99.6 /100 | #79 | Exceptional 5.2% |
| Sri Lankans | 99.6 /100 | #80 | Exceptional 5.2% |
| Native Hawaiians | 99.6 /100 | #81 | Exceptional 5.2% |
| Immigrants | Sweden | 99.5 /100 | #82 | Exceptional 5.2% |
| Immigrants | France | 99.5 /100 | #83 | Exceptional 5.2% |
| Immigrants | Nicaragua | 99.5 /100 | #84 | Exceptional 5.2% |
| Bulgarians | 99.4 /100 | #85 | Exceptional 5.2% |
| Immigrants | St. Vincent and the Grenadines | 99.4 /100 | #86 | Exceptional 5.2% |
| Eastern Europeans | 99.4 /100 | #87 | Exceptional 5.2% |
| Immigrants | Croatia | 99.4 /100 | #88 | Exceptional 5.2% |
| Immigrants | Spain | 99.4 /100 | #89 | Exceptional 5.2% |
| Immigrants | Kuwait | 99.4 /100 | #90 | Exceptional 5.3% |
| Mongolians | 99.2 /100 | #91 | Exceptional 5.3% |
| Luxembourgers | 99.2 /100 | #92 | Exceptional 5.3% |
| Immigrants | Peru | 99.1 /100 | #93 | Exceptional 5.3% |
Demographics Similar to Immigrants from Western Europe by Disability Age 5 to 17
In terms of disability age 5 to 17, the demographic groups most similar to Immigrants from Western Europe are Immigrants from Trinidad and Tobago (5.6%, a difference of 0.010%), Shoshone (5.6%, a difference of 0.080%), Immigrants from Central America (5.6%, a difference of 0.080%), Costa Rican (5.6%, a difference of 0.11%), and Uruguayan (5.6%, a difference of 0.16%).
| Demographics | Rating | Rank | Disability Age 5 to 17 |
| Serbians | 54.0 /100 | #170 | Average 5.6% |
| Immigrants | Iraq | 53.9 /100 | #171 | Average 5.6% |
| Ukrainians | 51.5 /100 | #172 | Average 5.6% |
| Uruguayans | 51.0 /100 | #173 | Average 5.6% |
| Costa Ricans | 50.0 /100 | #174 | Average 5.6% |
| Shoshone | 49.4 /100 | #175 | Average 5.6% |
| Immigrants | Central America | 49.4 /100 | #176 | Average 5.6% |
| Immigrants | Western Europe | 47.8 /100 | #177 | Average 5.6% |
| Immigrants | Trinidad and Tobago | 47.6 /100 | #178 | Average 5.6% |
| Immigrants | Barbados | 40.5 /100 | #179 | Average 5.6% |
| Immigrants | Uruguay | 37.7 /100 | #180 | Fair 5.6% |
| Immigrants | England | 36.4 /100 | #181 | Fair 5.6% |
| Mexican American Indians | 35.2 /100 | #182 | Fair 5.6% |
| Immigrants | Latin America | 34.3 /100 | #183 | Fair 5.6% |
| Syrians | 33.8 /100 | #184 | Fair 5.6% |