Immigrants from South Eastern Asia vs Macedonian Disability Age Under 5
COMPARE
Immigrants from South Eastern Asia
Macedonian
Disability Age Under 5
Disability Age Under 5 Comparison
Immigrants from South Eastern Asia
Macedonians
1.1%
DISABILITY AGE UNDER 5
96.5/ 100
METRIC RATING
98th/ 347
METRIC RANK
1.2%
DISABILITY AGE UNDER 5
43.7/ 100
METRIC RATING
181st/ 347
METRIC RANK
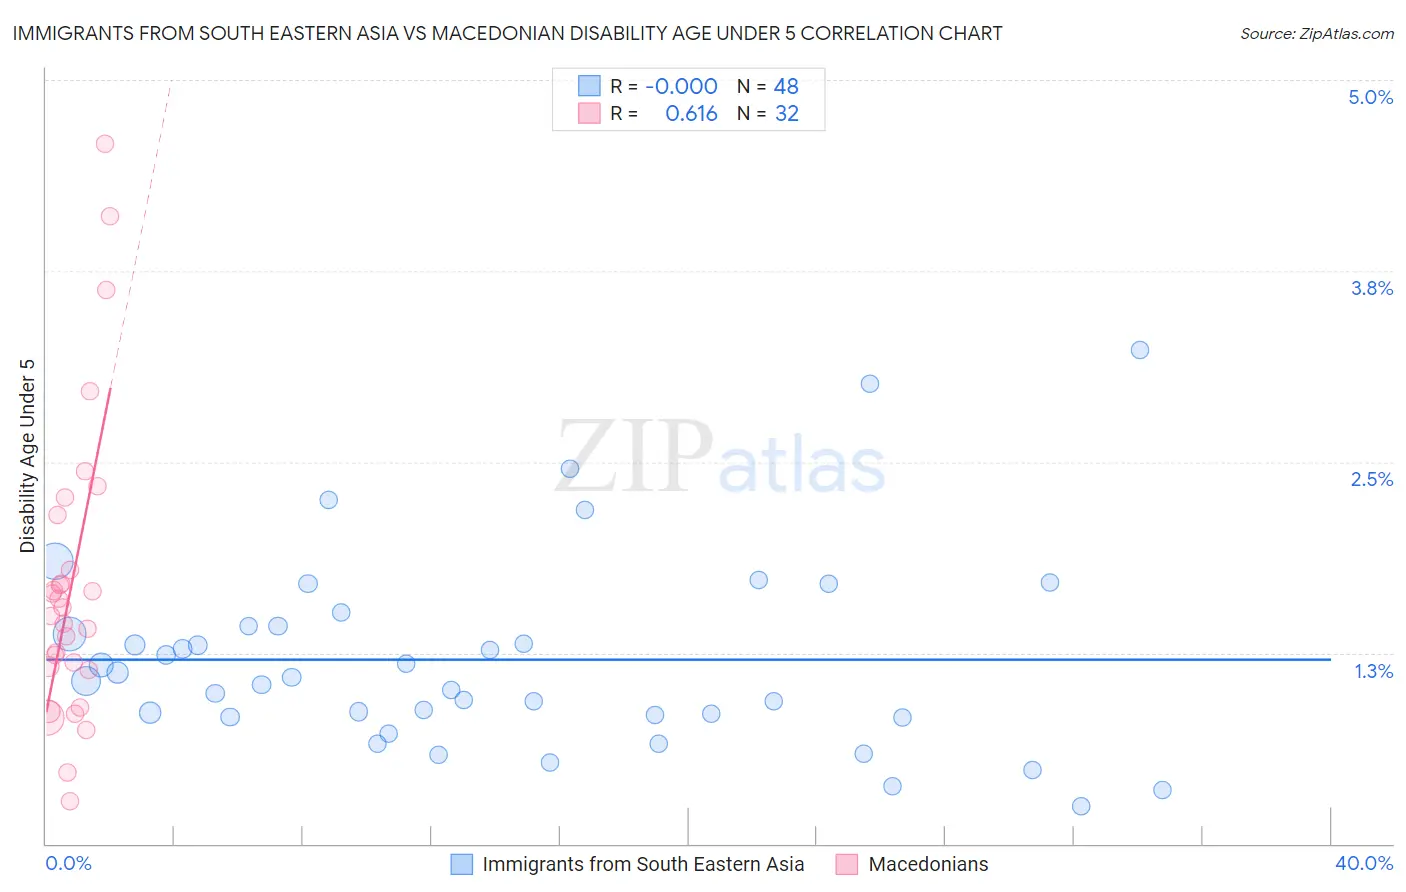
Immigrants from South Eastern Asia vs Macedonian Disability Age Under 5 Correlation Chart
The statistical analysis conducted on geographies consisting of 251,042,035 people shows no correlation between the proportion of Immigrants from South Eastern Asia and percentage of population with a disability under the age of 5 in the United States with a correlation coefficient (R) of -0.000 and weighted average of 1.1%. Similarly, the statistical analysis conducted on geographies consisting of 91,108,284 people shows a significant positive correlation between the proportion of Macedonians and percentage of population with a disability under the age of 5 in the United States with a correlation coefficient (R) of 0.616 and weighted average of 1.2%, a difference of 8.7%.
Disability Age Under 5 Correlation Summary
| Measurement | Immigrants from South Eastern Asia | Macedonian |
| Minimum | 0.25% | 0.28% |
| Maximum | 3.2% | 4.6% |
| Range | 3.0% | 4.3% |
| Mean | 1.2% | 1.7% |
| Median | 1.1% | 1.5% |
| Interquartile 25% (IQ1) | 0.84% | 1.1% |
| Interquartile 75% (IQ3) | 1.4% | 2.0% |
| Interquartile Range (IQR) | 0.59% | 0.82% |
| Standard Deviation (Sample) | 0.63% | 0.98% |
| Standard Deviation (Population) | 0.63% | 0.97% |
Similar Demographics by Disability Age Under 5
Demographics Similar to Immigrants from South Eastern Asia by Disability Age Under 5
In terms of disability age under 5, the demographic groups most similar to Immigrants from South Eastern Asia are Immigrants from Iraq (1.1%, a difference of 0.010%), Mongolian (1.1%, a difference of 0.11%), Dominican (1.1%, a difference of 0.13%), Nicaraguan (1.1%, a difference of 0.15%), and Immigrants from Moldova (1.1%, a difference of 0.22%).
| Demographics | Rating | Rank | Disability Age Under 5 |
| Albanians | 97.2 /100 | #91 | Exceptional 1.1% |
| Immigrants | Cuba | 97.0 /100 | #92 | Exceptional 1.1% |
| Spanish Americans | 96.9 /100 | #93 | Exceptional 1.1% |
| Sri Lankans | 96.8 /100 | #94 | Exceptional 1.1% |
| Immigrants | Moldova | 96.8 /100 | #95 | Exceptional 1.1% |
| Mongolians | 96.6 /100 | #96 | Exceptional 1.1% |
| Immigrants | Iraq | 96.5 /100 | #97 | Exceptional 1.1% |
| Immigrants | South Eastern Asia | 96.5 /100 | #98 | Exceptional 1.1% |
| Dominicans | 96.3 /100 | #99 | Exceptional 1.1% |
| Nicaraguans | 96.3 /100 | #100 | Exceptional 1.1% |
| Immigrants | Uganda | 96.1 /100 | #101 | Exceptional 1.1% |
| Immigrants | Morocco | 96.0 /100 | #102 | Exceptional 1.2% |
| Immigrants | Nicaragua | 96.0 /100 | #103 | Exceptional 1.2% |
| Indonesians | 95.9 /100 | #104 | Exceptional 1.2% |
| Immigrants | South Africa | 95.6 /100 | #105 | Exceptional 1.2% |
Demographics Similar to Macedonians by Disability Age Under 5
In terms of disability age under 5, the demographic groups most similar to Macedonians are Immigrants from Peru (1.2%, a difference of 0.0%), Immigrants from Saudi Arabia (1.2%, a difference of 0.040%), Palestinian (1.2%, a difference of 0.060%), Immigrants from Mexico (1.2%, a difference of 0.070%), and Immigrants from Western Africa (1.2%, a difference of 0.11%).
| Demographics | Rating | Rank | Disability Age Under 5 |
| Immigrants | Latvia | 50.0 /100 | #174 | Average 1.2% |
| Immigrants | Nigeria | 50.0 /100 | #175 | Average 1.2% |
| Immigrants | Kenya | 48.6 /100 | #176 | Average 1.2% |
| Comanche | 47.5 /100 | #177 | Average 1.2% |
| Venezuelans | 47.1 /100 | #178 | Average 1.2% |
| Immigrants | Bahamas | 45.2 /100 | #179 | Average 1.2% |
| Immigrants | Mexico | 44.4 /100 | #180 | Average 1.2% |
| Immigrants | Peru | 43.7 /100 | #181 | Average 1.2% |
| Macedonians | 43.7 /100 | #181 | Average 1.2% |
| Immigrants | Saudi Arabia | 43.3 /100 | #183 | Average 1.2% |
| Palestinians | 43.0 /100 | #184 | Average 1.2% |
| Immigrants | Western Africa | 42.5 /100 | #185 | Average 1.2% |
| Cubans | 42.5 /100 | #186 | Average 1.2% |
| Immigrants | Haiti | 40.2 /100 | #187 | Average 1.3% |
| Haitians | 39.9 /100 | #188 | Fair 1.3% |