Immigrants from South Central Asia vs Immigrants from Central America Disability
COMPARE
Immigrants from South Central Asia
Immigrants from Central America
Disability
Disability Comparison
Immigrants from South Central Asia
Immigrants from Central America
9.9%
DISABILITY
100.0/ 100
METRIC RATING
6th/ 347
METRIC RANK
11.7%
DISABILITY
46.6/ 100
METRIC RATING
177th/ 347
METRIC RANK
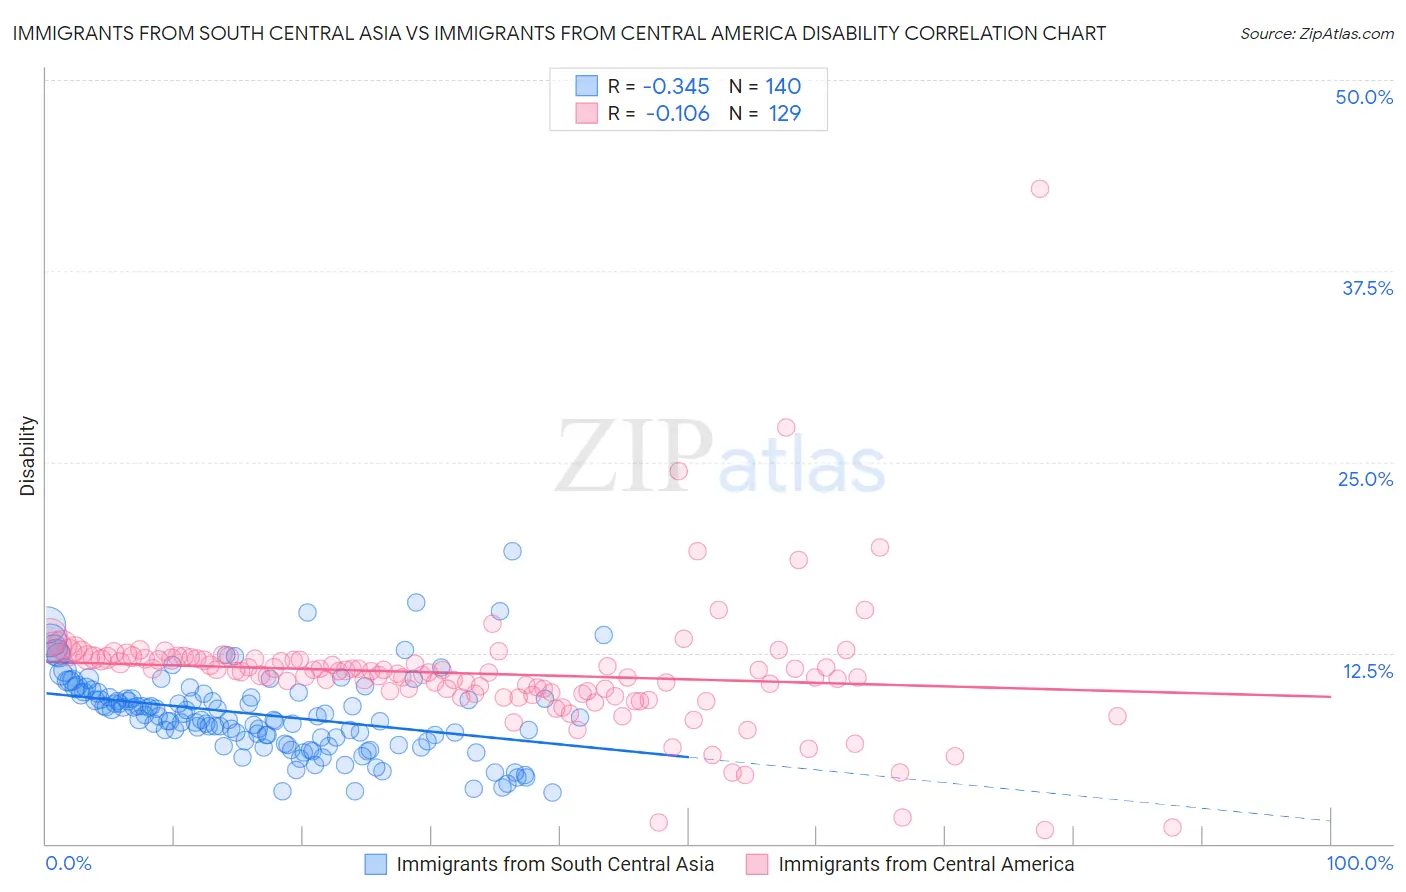
Immigrants from South Central Asia vs Immigrants from Central America Disability Correlation Chart
The statistical analysis conducted on geographies consisting of 473,067,496 people shows a mild negative correlation between the proportion of Immigrants from South Central Asia and percentage of population with a disability in the United States with a correlation coefficient (R) of -0.345 and weighted average of 9.9%. Similarly, the statistical analysis conducted on geographies consisting of 536,390,907 people shows a poor negative correlation between the proportion of Immigrants from Central America and percentage of population with a disability in the United States with a correlation coefficient (R) of -0.106 and weighted average of 11.7%, a difference of 17.8%.
Disability Correlation Summary
| Measurement | Immigrants from South Central Asia | Immigrants from Central America |
| Minimum | 3.4% | 0.89% |
| Maximum | 19.2% | 42.9% |
| Range | 15.8% | 42.0% |
| Mean | 8.5% | 11.1% |
| Median | 8.3% | 11.3% |
| Interquartile 25% (IQ1) | 6.7% | 9.8% |
| Interquartile 75% (IQ3) | 9.8% | 12.1% |
| Interquartile Range (IQR) | 3.1% | 2.3% |
| Standard Deviation (Sample) | 2.7% | 4.4% |
| Standard Deviation (Population) | 2.7% | 4.4% |
Similar Demographics by Disability
Demographics Similar to Immigrants from South Central Asia by Disability
In terms of disability, the demographic groups most similar to Immigrants from South Central Asia are Immigrants from Singapore (10.0%, a difference of 0.31%), Bolivian (10.0%, a difference of 0.54%), Immigrants from Bolivia (9.9%, a difference of 0.84%), Immigrants from Hong Kong (10.0%, a difference of 0.84%), and Immigrants from China (10.1%, a difference of 1.7%).
| Demographics | Rating | Rank | Disability |
| Immigrants | India | 100.0 /100 | #1 | Exceptional 9.5% |
| Filipinos | 100.0 /100 | #2 | Exceptional 9.6% |
| Immigrants | Taiwan | 100.0 /100 | #3 | Exceptional 9.6% |
| Thais | 100.0 /100 | #4 | Exceptional 9.7% |
| Immigrants | Bolivia | 100.0 /100 | #5 | Exceptional 9.9% |
| Immigrants | South Central Asia | 100.0 /100 | #6 | Exceptional 9.9% |
| Immigrants | Singapore | 100.0 /100 | #7 | Exceptional 10.0% |
| Bolivians | 100.0 /100 | #8 | Exceptional 10.0% |
| Immigrants | Hong Kong | 100.0 /100 | #9 | Exceptional 10.0% |
| Immigrants | China | 100.0 /100 | #10 | Exceptional 10.1% |
| Iranians | 100.0 /100 | #11 | Exceptional 10.1% |
| Immigrants | Israel | 100.0 /100 | #12 | Exceptional 10.1% |
| Immigrants | Eastern Asia | 100.0 /100 | #13 | Exceptional 10.2% |
| Immigrants | Korea | 100.0 /100 | #14 | Exceptional 10.2% |
| Okinawans | 100.0 /100 | #15 | Exceptional 10.3% |
Demographics Similar to Immigrants from Central America by Disability
In terms of disability, the demographic groups most similar to Immigrants from Central America are Greek (11.7%, a difference of 0.020%), Immigrants from Western Africa (11.7%, a difference of 0.040%), Haitian (11.7%, a difference of 0.090%), Albanian (11.7%, a difference of 0.15%), and Maltese (11.7%, a difference of 0.18%).
| Demographics | Rating | Rank | Disability |
| Immigrants | Albania | 52.8 /100 | #170 | Average 11.7% |
| Immigrants | Southern Europe | 52.8 /100 | #171 | Average 11.7% |
| Trinidadians and Tobagonians | 52.7 /100 | #172 | Average 11.7% |
| Maltese | 50.6 /100 | #173 | Average 11.7% |
| Albanians | 50.0 /100 | #174 | Average 11.7% |
| Haitians | 48.6 /100 | #175 | Average 11.7% |
| Immigrants | Western Africa | 47.5 /100 | #176 | Average 11.7% |
| Immigrants | Central America | 46.6 /100 | #177 | Average 11.7% |
| Greeks | 46.2 /100 | #178 | Average 11.7% |
| Immigrants | Armenia | 41.9 /100 | #179 | Average 11.7% |
| Immigrants | Honduras | 37.8 /100 | #180 | Fair 11.8% |
| Immigrants | Oceania | 34.3 /100 | #181 | Fair 11.8% |
| Icelanders | 34.0 /100 | #182 | Fair 11.8% |
| Hondurans | 31.2 /100 | #183 | Fair 11.8% |
| Iraqis | 30.0 /100 | #184 | Fair 11.8% |