Immigrants from South Central Asia vs Alsatian Nursery School
COMPARE
Immigrants from South Central Asia
Alsatian
Nursery School
Nursery School Comparison
Immigrants from South Central Asia
Alsatians
98.0%
NURSERY SCHOOL
66.7/ 100
METRIC RATING
155th/ 347
METRIC RANK
98.1%
NURSERY SCHOOL
80.3/ 100
METRIC RATING
144th/ 347
METRIC RANK
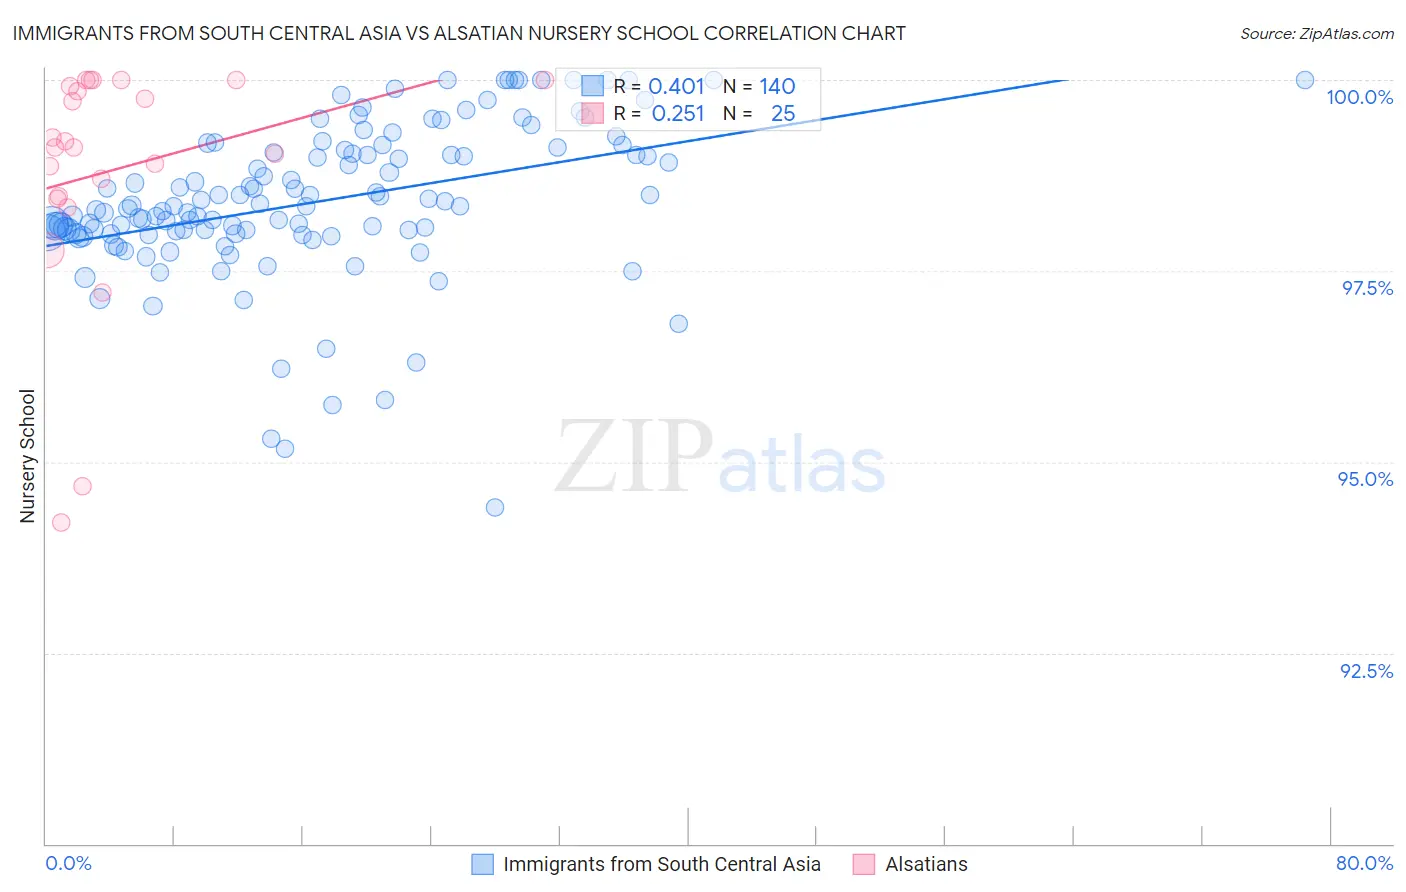
Immigrants from South Central Asia vs Alsatian Nursery School Correlation Chart
The statistical analysis conducted on geographies consisting of 473,113,181 people shows a moderate positive correlation between the proportion of Immigrants from South Central Asia and percentage of population with at least nursery school education in the United States with a correlation coefficient (R) of 0.401 and weighted average of 98.0%. Similarly, the statistical analysis conducted on geographies consisting of 82,682,365 people shows a weak positive correlation between the proportion of Alsatians and percentage of population with at least nursery school education in the United States with a correlation coefficient (R) of 0.251 and weighted average of 98.1%, a difference of 0.050%.
Nursery School Correlation Summary
| Measurement | Immigrants from South Central Asia | Alsatian |
| Minimum | 94.4% | 94.2% |
| Maximum | 100.0% | 100.0% |
| Range | 5.6% | 5.8% |
| Mean | 98.4% | 98.8% |
| Median | 98.3% | 99.1% |
| Interquartile 25% (IQ1) | 98.0% | 98.5% |
| Interquartile 75% (IQ3) | 99.1% | 100.0% |
| Interquartile Range (IQR) | 1.1% | 1.5% |
| Standard Deviation (Sample) | 1.0% | 1.5% |
| Standard Deviation (Population) | 1.0% | 1.5% |
Demographics Similar to Immigrants from South Central Asia and Alsatians by Nursery School
In terms of nursery school, the demographic groups most similar to Immigrants from South Central Asia are Venezuelan (98.0%, a difference of 0.0%), Comanche (98.0%, a difference of 0.0%), Immigrants from North Macedonia (98.0%, a difference of 0.0%), Dutch West Indian (98.0%, a difference of 0.010%), and Immigrants from Moldova (98.0%, a difference of 0.010%). Similarly, the demographic groups most similar to Alsatians are Marshallese (98.1%, a difference of 0.0%), Immigrants from Turkey (98.1%, a difference of 0.010%), Burmese (98.1%, a difference of 0.010%), Immigrants from Israel (98.1%, a difference of 0.010%), and Filipino (98.1%, a difference of 0.010%).
| Demographics | Rating | Rank | Nursery School |
| Blackfeet | 87.5 /100 | #139 | Excellent 98.1% |
| Palestinians | 83.7 /100 | #140 | Excellent 98.1% |
| Immigrants | Turkey | 83.0 /100 | #141 | Excellent 98.1% |
| Burmese | 81.7 /100 | #142 | Excellent 98.1% |
| Marshallese | 81.2 /100 | #143 | Excellent 98.1% |
| Alsatians | 80.3 /100 | #144 | Excellent 98.1% |
| Immigrants | Israel | 78.5 /100 | #145 | Good 98.1% |
| Filipinos | 78.5 /100 | #146 | Good 98.1% |
| Hmong | 75.7 /100 | #147 | Good 98.1% |
| Immigrants | Greece | 75.4 /100 | #148 | Good 98.1% |
| Apache | 73.2 /100 | #149 | Good 98.1% |
| Jordanians | 72.9 /100 | #150 | Good 98.1% |
| Soviet Union | 71.6 /100 | #151 | Good 98.0% |
| Dutch West Indians | 70.2 /100 | #152 | Good 98.0% |
| Immigrants | Moldova | 69.6 /100 | #153 | Good 98.0% |
| Immigrants | Iran | 68.7 /100 | #154 | Good 98.0% |
| Immigrants | South Central Asia | 66.7 /100 | #155 | Good 98.0% |
| Venezuelans | 66.6 /100 | #156 | Good 98.0% |
| Comanche | 66.0 /100 | #157 | Good 98.0% |
| Immigrants | North Macedonia | 65.7 /100 | #158 | Good 98.0% |
| French American Indians | 62.1 /100 | #159 | Good 98.0% |