Immigrants from South Central Asia vs Immigrants from Guyana Disability
COMPARE
Immigrants from South Central Asia
Immigrants from Guyana
Disability
Disability Comparison
Immigrants from South Central Asia
Immigrants from Guyana
9.9%
DISABILITY
100.0/ 100
METRIC RATING
6th/ 347
METRIC RANK
11.4%
DISABILITY
88.3/ 100
METRIC RATING
134th/ 347
METRIC RANK
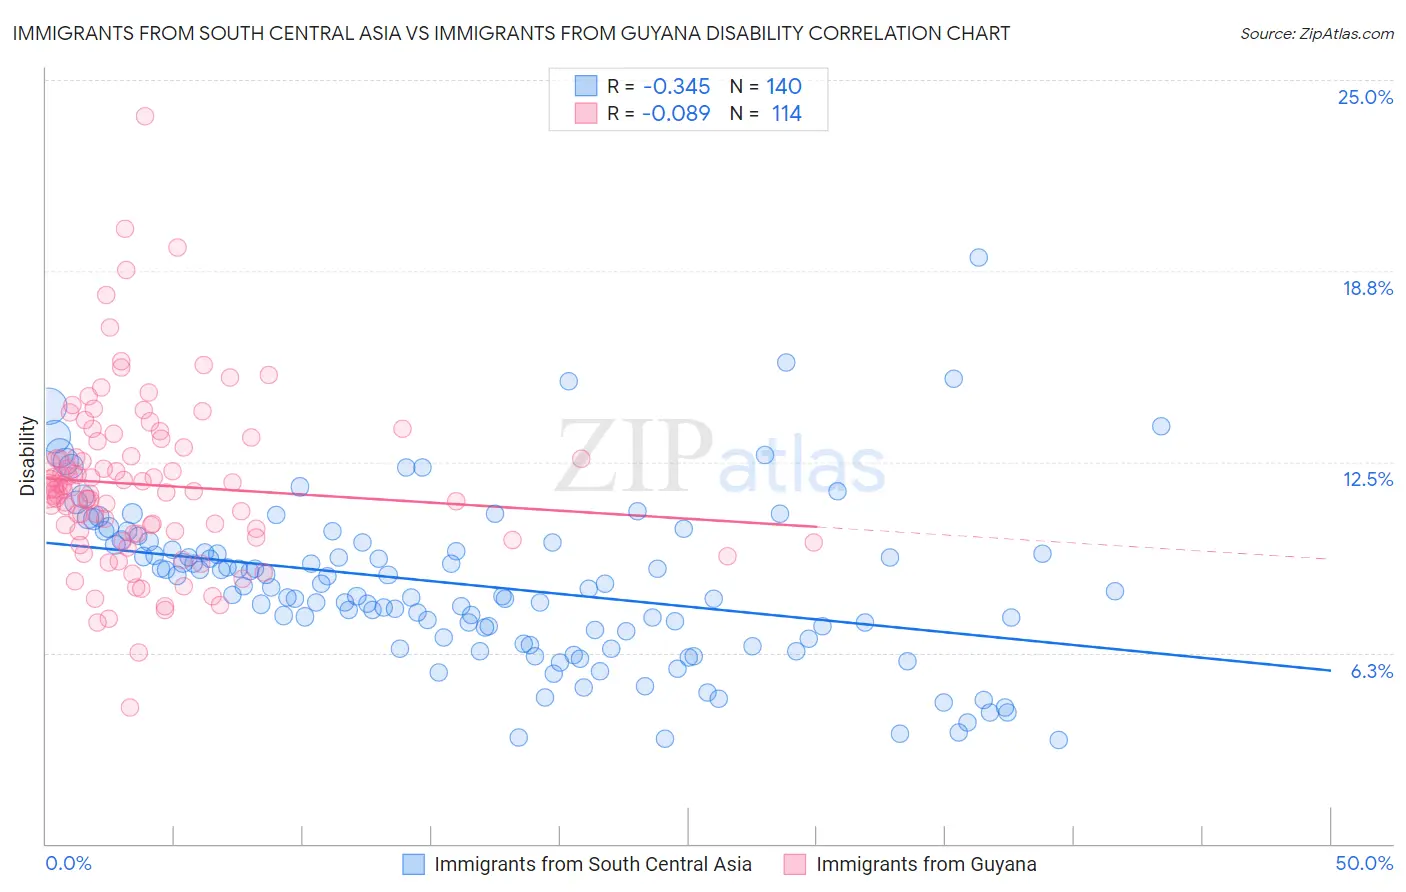
Immigrants from South Central Asia vs Immigrants from Guyana Disability Correlation Chart
The statistical analysis conducted on geographies consisting of 473,067,496 people shows a mild negative correlation between the proportion of Immigrants from South Central Asia and percentage of population with a disability in the United States with a correlation coefficient (R) of -0.345 and weighted average of 9.9%. Similarly, the statistical analysis conducted on geographies consisting of 183,715,267 people shows a slight negative correlation between the proportion of Immigrants from Guyana and percentage of population with a disability in the United States with a correlation coefficient (R) of -0.089 and weighted average of 11.4%, a difference of 15.0%.
Disability Correlation Summary
| Measurement | Immigrants from South Central Asia | Immigrants from Guyana |
| Minimum | 3.4% | 4.4% |
| Maximum | 19.2% | 23.8% |
| Range | 15.8% | 19.4% |
| Mean | 8.5% | 11.8% |
| Median | 8.3% | 11.6% |
| Interquartile 25% (IQ1) | 6.7% | 10.1% |
| Interquartile 75% (IQ3) | 9.8% | 13.0% |
| Interquartile Range (IQR) | 3.1% | 2.8% |
| Standard Deviation (Sample) | 2.7% | 2.8% |
| Standard Deviation (Population) | 2.7% | 2.8% |
Similar Demographics by Disability
Demographics Similar to Immigrants from South Central Asia by Disability
In terms of disability, the demographic groups most similar to Immigrants from South Central Asia are Immigrants from Singapore (10.0%, a difference of 0.31%), Bolivian (10.0%, a difference of 0.54%), Immigrants from Bolivia (9.9%, a difference of 0.84%), Immigrants from Hong Kong (10.0%, a difference of 0.84%), and Immigrants from China (10.1%, a difference of 1.7%).
| Demographics | Rating | Rank | Disability |
| Immigrants | India | 100.0 /100 | #1 | Exceptional 9.5% |
| Filipinos | 100.0 /100 | #2 | Exceptional 9.6% |
| Immigrants | Taiwan | 100.0 /100 | #3 | Exceptional 9.6% |
| Thais | 100.0 /100 | #4 | Exceptional 9.7% |
| Immigrants | Bolivia | 100.0 /100 | #5 | Exceptional 9.9% |
| Immigrants | South Central Asia | 100.0 /100 | #6 | Exceptional 9.9% |
| Immigrants | Singapore | 100.0 /100 | #7 | Exceptional 10.0% |
| Bolivians | 100.0 /100 | #8 | Exceptional 10.0% |
| Immigrants | Hong Kong | 100.0 /100 | #9 | Exceptional 10.0% |
| Immigrants | China | 100.0 /100 | #10 | Exceptional 10.1% |
| Iranians | 100.0 /100 | #11 | Exceptional 10.1% |
| Immigrants | Israel | 100.0 /100 | #12 | Exceptional 10.1% |
| Immigrants | Eastern Asia | 100.0 /100 | #13 | Exceptional 10.2% |
| Immigrants | Korea | 100.0 /100 | #14 | Exceptional 10.2% |
| Okinawans | 100.0 /100 | #15 | Exceptional 10.3% |
Demographics Similar to Immigrants from Guyana by Disability
In terms of disability, the demographic groups most similar to Immigrants from Guyana are Ugandan (11.4%, a difference of 0.050%), Immigrants from St. Vincent and the Grenadines (11.4%, a difference of 0.060%), Arab (11.4%, a difference of 0.080%), Immigrants from Africa (11.4%, a difference of 0.11%), and Kenyan (11.5%, a difference of 0.13%).
| Demographics | Rating | Rank | Disability |
| Immigrants | Italy | 90.4 /100 | #127 | Exceptional 11.4% |
| Immigrants | Europe | 90.4 /100 | #128 | Exceptional 11.4% |
| Macedonians | 90.3 /100 | #129 | Exceptional 11.4% |
| Latvians | 89.8 /100 | #130 | Excellent 11.4% |
| Immigrants | Croatia | 89.8 /100 | #131 | Excellent 11.4% |
| Immigrants | Africa | 89.3 /100 | #132 | Excellent 11.4% |
| Arabs | 89.1 /100 | #133 | Excellent 11.4% |
| Immigrants | Guyana | 88.3 /100 | #134 | Excellent 11.4% |
| Ugandans | 87.9 /100 | #135 | Excellent 11.4% |
| Immigrants | St. Vincent and the Grenadines | 87.8 /100 | #136 | Excellent 11.4% |
| Kenyans | 87.1 /100 | #137 | Excellent 11.5% |
| New Zealanders | 87.0 /100 | #138 | Excellent 11.5% |
| Ghanaians | 87.0 /100 | #139 | Excellent 11.5% |
| Russians | 86.8 /100 | #140 | Excellent 11.5% |
| Immigrants | Grenada | 86.1 /100 | #141 | Excellent 11.5% |