Immigrants from Russia vs Cambodian Male Disability
COMPARE
Immigrants from Russia
Cambodian
Male Disability
Male Disability Comparison
Immigrants from Russia
Cambodians
10.6%
MALE DISABILITY
98.6/ 100
METRIC RATING
78th/ 347
METRIC RANK
10.3%
MALE DISABILITY
99.7/ 100
METRIC RATING
46th/ 347
METRIC RANK
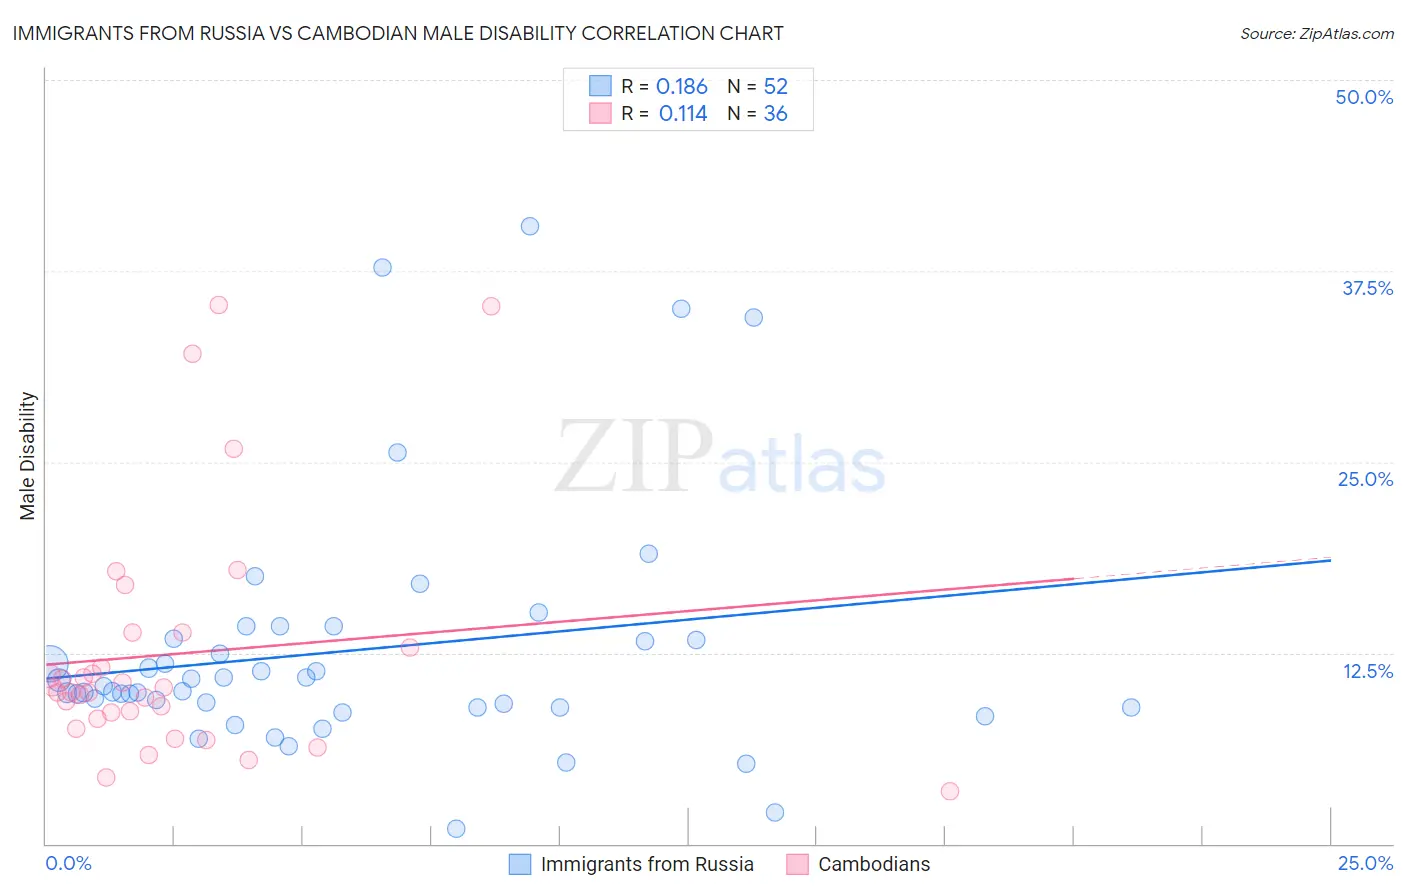
Immigrants from Russia vs Cambodian Male Disability Correlation Chart
The statistical analysis conducted on geographies consisting of 347,901,203 people shows a poor positive correlation between the proportion of Immigrants from Russia and percentage of males with a disability in the United States with a correlation coefficient (R) of 0.186 and weighted average of 10.6%. Similarly, the statistical analysis conducted on geographies consisting of 102,516,296 people shows a poor positive correlation between the proportion of Cambodians and percentage of males with a disability in the United States with a correlation coefficient (R) of 0.114 and weighted average of 10.3%, a difference of 2.3%.
Male Disability Correlation Summary
| Measurement | Immigrants from Russia | Cambodian |
| Minimum | 0.96% | 3.5% |
| Maximum | 40.4% | 35.3% |
| Range | 39.4% | 31.8% |
| Mean | 12.6% | 12.4% |
| Median | 10.2% | 10.1% |
| Interquartile 25% (IQ1) | 9.0% | 8.4% |
| Interquartile 75% (IQ3) | 13.4% | 13.4% |
| Interquartile Range (IQR) | 4.4% | 4.9% |
| Standard Deviation (Sample) | 8.1% | 7.9% |
| Standard Deviation (Population) | 8.0% | 7.8% |
Similar Demographics by Male Disability
Demographics Similar to Immigrants from Russia by Male Disability
In terms of male disability, the demographic groups most similar to Immigrants from Russia are Laotian (10.6%, a difference of 0.020%), Immigrants from Sierra Leone (10.5%, a difference of 0.080%), Sierra Leonean (10.5%, a difference of 0.12%), Zimbabwean (10.6%, a difference of 0.23%), and Immigrants from Lebanon (10.5%, a difference of 0.24%).
| Demographics | Rating | Rank | Male Disability |
| Immigrants | Cameroon | 99.0 /100 | #71 | Exceptional 10.5% |
| Immigrants | Serbia | 99.0 /100 | #72 | Exceptional 10.5% |
| Immigrants | Lithuania | 98.9 /100 | #73 | Exceptional 10.5% |
| Immigrants | Lebanon | 98.8 /100 | #74 | Exceptional 10.5% |
| Sierra Leoneans | 98.7 /100 | #75 | Exceptional 10.5% |
| Immigrants | Sierra Leone | 98.7 /100 | #76 | Exceptional 10.5% |
| Laotians | 98.6 /100 | #77 | Exceptional 10.6% |
| Immigrants | Russia | 98.6 /100 | #78 | Exceptional 10.6% |
| Zimbabweans | 98.4 /100 | #79 | Exceptional 10.6% |
| Immigrants | Jordan | 98.4 /100 | #80 | Exceptional 10.6% |
| Immigrants | Chile | 98.3 /100 | #81 | Exceptional 10.6% |
| Immigrants | Guyana | 98.2 /100 | #82 | Exceptional 10.6% |
| Immigrants | Poland | 98.1 /100 | #83 | Exceptional 10.6% |
| Bulgarians | 98.1 /100 | #84 | Exceptional 10.6% |
| Sri Lankans | 97.9 /100 | #85 | Exceptional 10.6% |
Demographics Similar to Cambodians by Male Disability
In terms of male disability, the demographic groups most similar to Cambodians are Immigrants from Peru (10.3%, a difference of 0.040%), Israeli (10.3%, a difference of 0.070%), Turkish (10.3%, a difference of 0.080%), Immigrants from El Salvador (10.3%, a difference of 0.090%), and Immigrants from Spain (10.3%, a difference of 0.13%).
| Demographics | Rating | Rank | Male Disability |
| Afghans | 99.8 /100 | #39 | Exceptional 10.2% |
| Immigrants | Nepal | 99.8 /100 | #40 | Exceptional 10.3% |
| Taiwanese | 99.8 /100 | #41 | Exceptional 10.3% |
| Mongolians | 99.7 /100 | #42 | Exceptional 10.3% |
| Immigrants | Bangladesh | 99.7 /100 | #43 | Exceptional 10.3% |
| Immigrants | El Salvador | 99.7 /100 | #44 | Exceptional 10.3% |
| Turks | 99.7 /100 | #45 | Exceptional 10.3% |
| Cambodians | 99.7 /100 | #46 | Exceptional 10.3% |
| Immigrants | Peru | 99.7 /100 | #47 | Exceptional 10.3% |
| Israelis | 99.7 /100 | #48 | Exceptional 10.3% |
| Immigrants | Spain | 99.7 /100 | #49 | Exceptional 10.3% |
| South Americans | 99.6 /100 | #50 | Exceptional 10.3% |
| Salvadorans | 99.6 /100 | #51 | Exceptional 10.4% |
| Immigrants | Saudi Arabia | 99.6 /100 | #52 | Exceptional 10.4% |
| Immigrants | Uzbekistan | 99.6 /100 | #53 | Exceptional 10.4% |