Immigrants from Russia vs Immigrants from Latvia No Schooling Completed
COMPARE
Immigrants from Russia
Immigrants from Latvia
No Schooling Completed
No Schooling Completed Comparison
Immigrants from Russia
Immigrants from Latvia
2.0%
NO SCHOOLING COMPLETED
67.6/ 100
METRIC RATING
155th/ 347
METRIC RANK
1.9%
NO SCHOOLING COMPLETED
96.7/ 100
METRIC RATING
110th/ 347
METRIC RANK
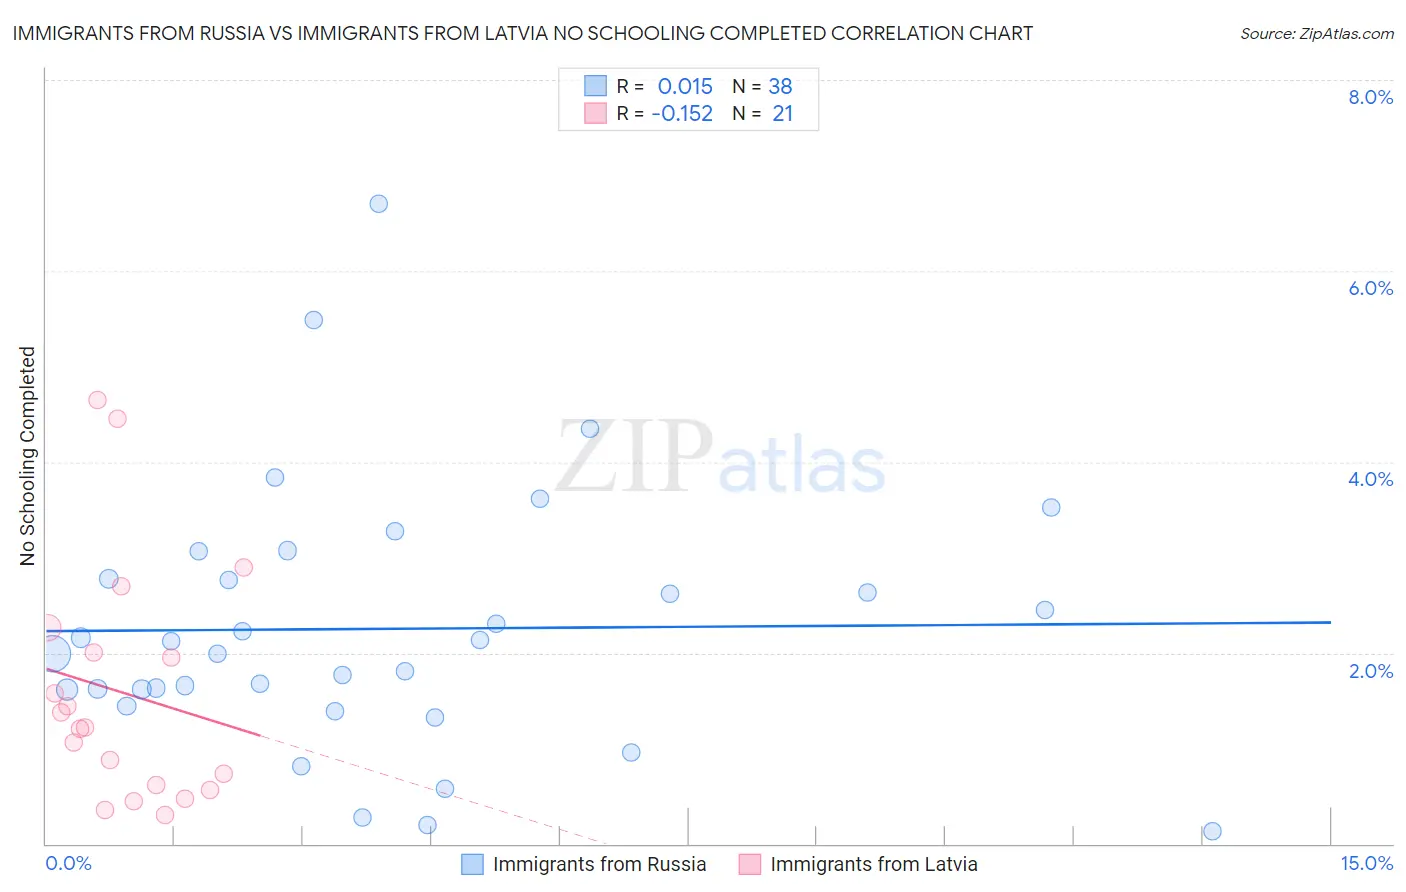
Immigrants from Russia vs Immigrants from Latvia No Schooling Completed Correlation Chart
The statistical analysis conducted on geographies consisting of 344,183,318 people shows no correlation between the proportion of Immigrants from Russia and percentage of population with no schooling in the United States with a correlation coefficient (R) of 0.015 and weighted average of 2.0%. Similarly, the statistical analysis conducted on geographies consisting of 113,303,053 people shows a poor negative correlation between the proportion of Immigrants from Latvia and percentage of population with no schooling in the United States with a correlation coefficient (R) of -0.152 and weighted average of 1.9%, a difference of 10.0%.
No Schooling Completed Correlation Summary
| Measurement | Immigrants from Russia | Immigrants from Latvia |
| Minimum | 0.13% | 0.30% |
| Maximum | 6.7% | 4.7% |
| Range | 6.6% | 4.4% |
| Mean | 2.3% | 1.6% |
| Median | 2.1% | 1.2% |
| Interquartile 25% (IQ1) | 1.6% | 0.59% |
| Interquartile 75% (IQ3) | 2.8% | 2.1% |
| Interquartile Range (IQR) | 1.2% | 1.5% |
| Standard Deviation (Sample) | 1.4% | 1.2% |
| Standard Deviation (Population) | 1.3% | 1.2% |
Similar Demographics by No Schooling Completed
Demographics Similar to Immigrants from Russia by No Schooling Completed
In terms of no schooling completed, the demographic groups most similar to Immigrants from Russia are Chilean (2.0%, a difference of 0.070%), Immigrants from Sri Lanka (2.0%, a difference of 0.10%), Immigrants from Venezuela (2.0%, a difference of 0.14%), Immigrants from Korea (2.0%, a difference of 0.14%), and Immigrants from Spain (2.0%, a difference of 0.19%).
| Demographics | Rating | Rank | No Schooling Completed |
| Shoshone | 76.7 /100 | #148 | Good 2.0% |
| Immigrants | North Macedonia | 75.9 /100 | #149 | Good 2.0% |
| Blackfeet | 72.9 /100 | #150 | Good 2.0% |
| Immigrants | Jordan | 70.9 /100 | #151 | Good 2.0% |
| Immigrants | Eastern Europe | 70.4 /100 | #152 | Good 2.0% |
| Immigrants | Italy | 68.9 /100 | #153 | Good 2.0% |
| Immigrants | Venezuela | 68.5 /100 | #154 | Good 2.0% |
| Immigrants | Russia | 67.6 /100 | #155 | Good 2.0% |
| Chileans | 67.2 /100 | #156 | Good 2.0% |
| Immigrants | Sri Lanka | 67.0 /100 | #157 | Good 2.0% |
| Immigrants | Korea | 66.7 /100 | #158 | Good 2.0% |
| Immigrants | Spain | 66.4 /100 | #159 | Good 2.0% |
| Kenyans | 65.7 /100 | #160 | Good 2.0% |
| Ugandans | 64.6 /100 | #161 | Good 2.0% |
| Immigrants | Brazil | 63.8 /100 | #162 | Good 2.1% |
Demographics Similar to Immigrants from Latvia by No Schooling Completed
In terms of no schooling completed, the demographic groups most similar to Immigrants from Latvia are Immigrants from Saudi Arabia (1.9%, a difference of 0.13%), Immigrants from Japan (1.9%, a difference of 0.15%), Pueblo (1.9%, a difference of 0.33%), Okinawan (1.8%, a difference of 0.48%), and Immigrants from Zimbabwe (1.9%, a difference of 0.58%).
| Demographics | Rating | Rank | No Schooling Completed |
| Basques | 97.9 /100 | #103 | Exceptional 1.8% |
| Thais | 97.5 /100 | #104 | Exceptional 1.8% |
| German Russians | 97.5 /100 | #105 | Exceptional 1.8% |
| Immigrants | France | 97.3 /100 | #106 | Exceptional 1.8% |
| Yugoslavians | 97.2 /100 | #107 | Exceptional 1.8% |
| Okinawans | 97.1 /100 | #108 | Exceptional 1.8% |
| Immigrants | Saudi Arabia | 96.8 /100 | #109 | Exceptional 1.9% |
| Immigrants | Latvia | 96.7 /100 | #110 | Exceptional 1.9% |
| Immigrants | Japan | 96.6 /100 | #111 | Exceptional 1.9% |
| Pueblo | 96.4 /100 | #112 | Exceptional 1.9% |
| Immigrants | Zimbabwe | 96.2 /100 | #113 | Exceptional 1.9% |
| Immigrants | Norway | 96.1 /100 | #114 | Exceptional 1.9% |
| Syrians | 96.0 /100 | #115 | Exceptional 1.9% |
| Lebanese | 96.0 /100 | #116 | Exceptional 1.9% |
| Immigrants | Serbia | 95.8 /100 | #117 | Exceptional 1.9% |