Argentinean vs Immigrants from Cuba Disability
COMPARE
Argentinean
Immigrants from Cuba
Disability
Disability Comparison
Argentineans
Immigrants from Cuba
10.6%
DISABILITY
100.0/ 100
METRIC RATING
26th/ 347
METRIC RANK
11.6%
DISABILITY
62.8/ 100
METRIC RATING
161st/ 347
METRIC RANK
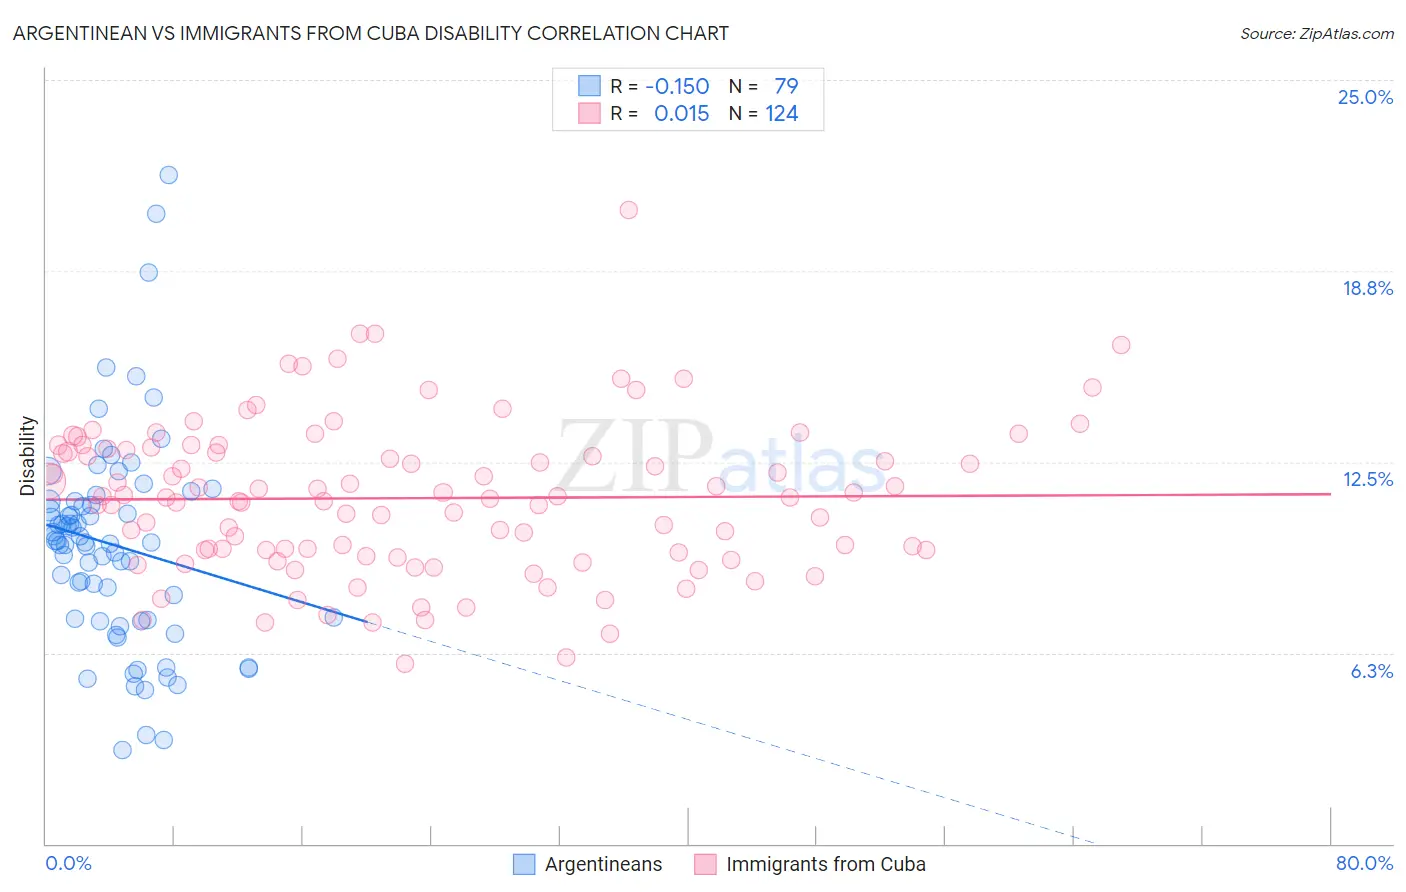
Argentinean vs Immigrants from Cuba Disability Correlation Chart
The statistical analysis conducted on geographies consisting of 297,145,092 people shows a poor negative correlation between the proportion of Argentineans and percentage of population with a disability in the United States with a correlation coefficient (R) of -0.150 and weighted average of 10.6%. Similarly, the statistical analysis conducted on geographies consisting of 325,999,543 people shows no correlation between the proportion of Immigrants from Cuba and percentage of population with a disability in the United States with a correlation coefficient (R) of 0.015 and weighted average of 11.6%, a difference of 9.9%.
Disability Correlation Summary
| Measurement | Argentinean | Immigrants from Cuba |
| Minimum | 3.1% | 5.9% |
| Maximum | 21.9% | 20.7% |
| Range | 18.8% | 14.8% |
| Mean | 9.8% | 11.3% |
| Median | 9.9% | 11.3% |
| Interquartile 25% (IQ1) | 7.3% | 9.6% |
| Interquartile 75% (IQ3) | 11.2% | 12.9% |
| Interquartile Range (IQR) | 3.9% | 3.3% |
| Standard Deviation (Sample) | 3.4% | 2.5% |
| Standard Deviation (Population) | 3.4% | 2.5% |
Similar Demographics by Disability
Demographics Similar to Argentineans by Disability
In terms of disability, the demographic groups most similar to Argentineans are Cypriot (10.6%, a difference of 0.010%), Immigrants from Malaysia (10.6%, a difference of 0.050%), Egyptian (10.6%, a difference of 0.14%), Immigrants from Argentina (10.6%, a difference of 0.27%), and Immigrants from Turkey (10.6%, a difference of 0.42%).
| Demographics | Rating | Rank | Disability |
| Immigrants | Pakistan | 100.0 /100 | #19 | Exceptional 10.4% |
| Immigrants | Venezuela | 100.0 /100 | #20 | Exceptional 10.4% |
| Asians | 100.0 /100 | #21 | Exceptional 10.4% |
| Immigrants | Sri Lanka | 100.0 /100 | #22 | Exceptional 10.5% |
| Immigrants | Asia | 100.0 /100 | #23 | Exceptional 10.5% |
| Venezuelans | 100.0 /100 | #24 | Exceptional 10.5% |
| Immigrants | Malaysia | 100.0 /100 | #25 | Exceptional 10.6% |
| Argentineans | 100.0 /100 | #26 | Exceptional 10.6% |
| Cypriots | 100.0 /100 | #27 | Exceptional 10.6% |
| Egyptians | 100.0 /100 | #28 | Exceptional 10.6% |
| Immigrants | Argentina | 100.0 /100 | #29 | Exceptional 10.6% |
| Immigrants | Turkey | 100.0 /100 | #30 | Exceptional 10.6% |
| Immigrants | Egypt | 100.0 /100 | #31 | Exceptional 10.6% |
| Paraguayans | 100.0 /100 | #32 | Exceptional 10.6% |
| Immigrants | Kuwait | 100.0 /100 | #33 | Exceptional 10.7% |
Demographics Similar to Immigrants from Cuba by Disability
In terms of disability, the demographic groups most similar to Immigrants from Cuba are Immigrants from Barbados (11.6%, a difference of 0.070%), Guatemalan (11.6%, a difference of 0.11%), Armenian (11.6%, a difference of 0.15%), Immigrants from Haiti (11.7%, a difference of 0.17%), and Immigrants from Trinidad and Tobago (11.7%, a difference of 0.19%).
| Demographics | Rating | Rank | Disability |
| Immigrants | Guatemala | 71.1 /100 | #154 | Good 11.6% |
| Immigrants | Netherlands | 69.8 /100 | #155 | Good 11.6% |
| Immigrants | Fiji | 69.5 /100 | #156 | Good 11.6% |
| Immigrants | Middle Africa | 69.5 /100 | #157 | Good 11.6% |
| Armenians | 65.9 /100 | #158 | Good 11.6% |
| Guatemalans | 65.1 /100 | #159 | Good 11.6% |
| Immigrants | Barbados | 64.2 /100 | #160 | Good 11.6% |
| Immigrants | Cuba | 62.8 /100 | #161 | Good 11.6% |
| Immigrants | Haiti | 59.2 /100 | #162 | Average 11.7% |
| Immigrants | Trinidad and Tobago | 58.9 /100 | #163 | Average 11.7% |
| Syrians | 58.5 /100 | #164 | Average 11.7% |
| Cubans | 56.7 /100 | #165 | Average 11.7% |
| Pakistanis | 54.7 /100 | #166 | Average 11.7% |
| Estonians | 54.4 /100 | #167 | Average 11.7% |
| Immigrants | Latin America | 54.1 /100 | #168 | Average 11.7% |