Liberian vs Immigrants from Cuba Disability
COMPARE
Liberian
Immigrants from Cuba
Disability
Disability Comparison
Liberians
Immigrants from Cuba
12.2%
DISABILITY
1.5/ 100
METRIC RATING
245th/ 347
METRIC RANK
11.6%
DISABILITY
62.8/ 100
METRIC RATING
161st/ 347
METRIC RANK
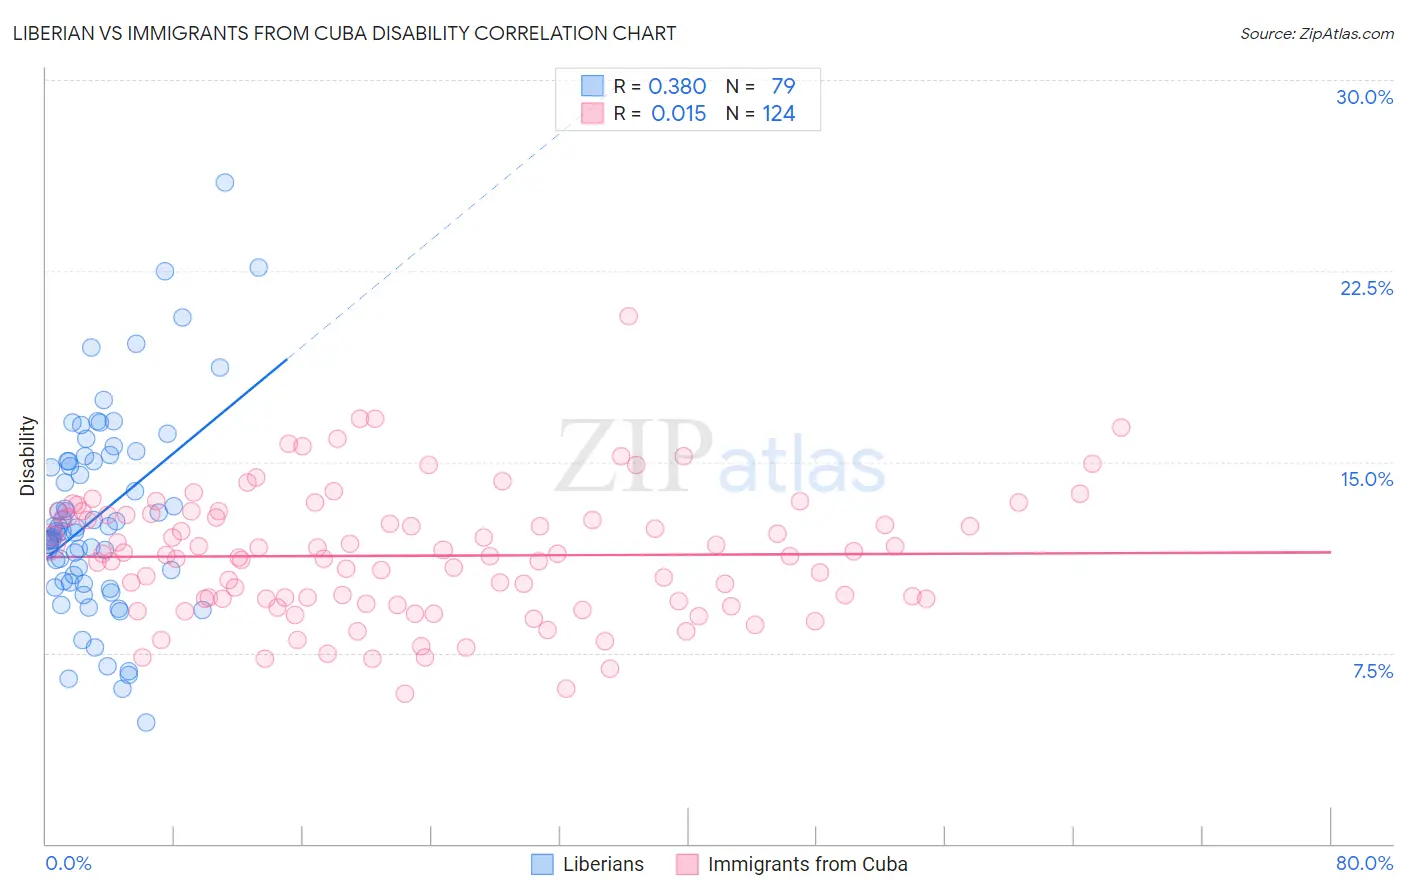
Liberian vs Immigrants from Cuba Disability Correlation Chart
The statistical analysis conducted on geographies consisting of 118,083,063 people shows a mild positive correlation between the proportion of Liberians and percentage of population with a disability in the United States with a correlation coefficient (R) of 0.380 and weighted average of 12.2%. Similarly, the statistical analysis conducted on geographies consisting of 325,999,543 people shows no correlation between the proportion of Immigrants from Cuba and percentage of population with a disability in the United States with a correlation coefficient (R) of 0.015 and weighted average of 11.6%, a difference of 5.2%.
Disability Correlation Summary
| Measurement | Liberian | Immigrants from Cuba |
| Minimum | 4.8% | 5.9% |
| Maximum | 26.0% | 20.7% |
| Range | 21.2% | 14.8% |
| Mean | 12.9% | 11.3% |
| Median | 12.3% | 11.3% |
| Interquartile 25% (IQ1) | 10.3% | 9.6% |
| Interquartile 75% (IQ3) | 15.0% | 12.9% |
| Interquartile Range (IQR) | 4.7% | 3.3% |
| Standard Deviation (Sample) | 3.9% | 2.5% |
| Standard Deviation (Population) | 3.9% | 2.5% |
Similar Demographics by Disability
Demographics Similar to Liberians by Disability
In terms of disability, the demographic groups most similar to Liberians are British (12.2%, a difference of 0.020%), Basque (12.2%, a difference of 0.020%), Swiss (12.2%, a difference of 0.030%), Indonesian (12.2%, a difference of 0.060%), and Polish (12.2%, a difference of 0.10%).
| Demographics | Rating | Rank | Disability |
| Norwegians | 1.9 /100 | #238 | Tragic 12.2% |
| Swedes | 1.8 /100 | #239 | Tragic 12.2% |
| Hungarians | 1.7 /100 | #240 | Tragic 12.2% |
| Yugoslavians | 1.7 /100 | #241 | Tragic 12.2% |
| Poles | 1.7 /100 | #242 | Tragic 12.2% |
| British | 1.5 /100 | #243 | Tragic 12.2% |
| Basques | 1.5 /100 | #244 | Tragic 12.2% |
| Liberians | 1.5 /100 | #245 | Tragic 12.2% |
| Swiss | 1.5 /100 | #246 | Tragic 12.2% |
| Indonesians | 1.4 /100 | #247 | Tragic 12.2% |
| Guamanians/Chamorros | 1.4 /100 | #248 | Tragic 12.3% |
| Carpatho Rusyns | 1.4 /100 | #249 | Tragic 12.3% |
| Sub-Saharan Africans | 1.4 /100 | #250 | Tragic 12.3% |
| Europeans | 1.4 /100 | #251 | Tragic 12.3% |
| Bermudans | 1.1 /100 | #252 | Tragic 12.3% |
Demographics Similar to Immigrants from Cuba by Disability
In terms of disability, the demographic groups most similar to Immigrants from Cuba are Immigrants from Barbados (11.6%, a difference of 0.070%), Guatemalan (11.6%, a difference of 0.11%), Armenian (11.6%, a difference of 0.15%), Immigrants from Haiti (11.7%, a difference of 0.17%), and Immigrants from Trinidad and Tobago (11.7%, a difference of 0.19%).
| Demographics | Rating | Rank | Disability |
| Immigrants | Guatemala | 71.1 /100 | #154 | Good 11.6% |
| Immigrants | Netherlands | 69.8 /100 | #155 | Good 11.6% |
| Immigrants | Fiji | 69.5 /100 | #156 | Good 11.6% |
| Immigrants | Middle Africa | 69.5 /100 | #157 | Good 11.6% |
| Armenians | 65.9 /100 | #158 | Good 11.6% |
| Guatemalans | 65.1 /100 | #159 | Good 11.6% |
| Immigrants | Barbados | 64.2 /100 | #160 | Good 11.6% |
| Immigrants | Cuba | 62.8 /100 | #161 | Good 11.6% |
| Immigrants | Haiti | 59.2 /100 | #162 | Average 11.7% |
| Immigrants | Trinidad and Tobago | 58.9 /100 | #163 | Average 11.7% |
| Syrians | 58.5 /100 | #164 | Average 11.7% |
| Cubans | 56.7 /100 | #165 | Average 11.7% |
| Pakistanis | 54.7 /100 | #166 | Average 11.7% |
| Estonians | 54.4 /100 | #167 | Average 11.7% |
| Immigrants | Latin America | 54.1 /100 | #168 | Average 11.7% |