Immigrants from Canada vs Immigrants from Cuba Disability
COMPARE
Immigrants from Canada
Immigrants from Cuba
Disability
Disability Comparison
Immigrants from Canada
Immigrants from Cuba
12.1%
DISABILITY
6.1/ 100
METRIC RATING
215th/ 347
METRIC RANK
11.6%
DISABILITY
62.8/ 100
METRIC RATING
161st/ 347
METRIC RANK
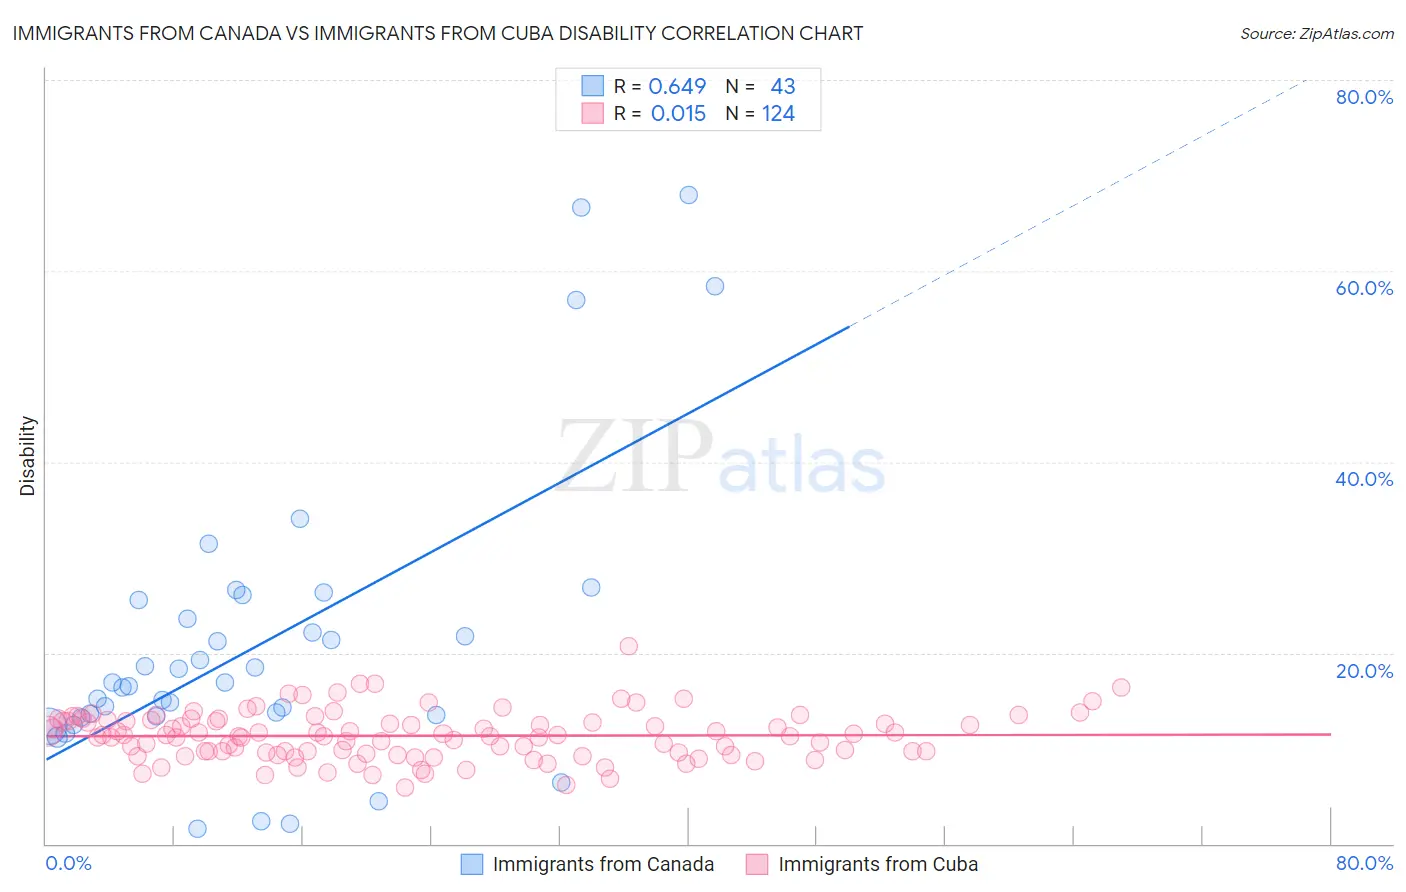
Immigrants from Canada vs Immigrants from Cuba Disability Correlation Chart
The statistical analysis conducted on geographies consisting of 459,374,446 people shows a significant positive correlation between the proportion of Immigrants from Canada and percentage of population with a disability in the United States with a correlation coefficient (R) of 0.649 and weighted average of 12.1%. Similarly, the statistical analysis conducted on geographies consisting of 325,999,543 people shows no correlation between the proportion of Immigrants from Cuba and percentage of population with a disability in the United States with a correlation coefficient (R) of 0.015 and weighted average of 11.6%, a difference of 3.6%.
Disability Correlation Summary
| Measurement | Immigrants from Canada | Immigrants from Cuba |
| Minimum | 1.6% | 5.9% |
| Maximum | 68.0% | 20.7% |
| Range | 66.4% | 14.8% |
| Mean | 21.0% | 11.3% |
| Median | 16.9% | 11.3% |
| Interquartile 25% (IQ1) | 13.3% | 9.6% |
| Interquartile 75% (IQ3) | 25.6% | 12.9% |
| Interquartile Range (IQR) | 12.2% | 3.3% |
| Standard Deviation (Sample) | 15.3% | 2.5% |
| Standard Deviation (Population) | 15.2% | 2.5% |
Similar Demographics by Disability
Demographics Similar to Immigrants from Canada by Disability
In terms of disability, the demographic groups most similar to Immigrants from Canada are Immigrants from Somalia (12.0%, a difference of 0.13%), Panamanian (12.1%, a difference of 0.15%), Immigrants from North America (12.1%, a difference of 0.16%), Austrian (12.0%, a difference of 0.18%), and Immigrants from Iraq (12.0%, a difference of 0.18%).
| Demographics | Rating | Rank | Disability |
| Immigrants | Caribbean | 9.1 /100 | #208 | Tragic 12.0% |
| Danes | 8.7 /100 | #209 | Tragic 12.0% |
| Czechs | 7.9 /100 | #210 | Tragic 12.0% |
| Immigrants | Cambodia | 7.3 /100 | #211 | Tragic 12.0% |
| Austrians | 7.2 /100 | #212 | Tragic 12.0% |
| Immigrants | Iraq | 7.1 /100 | #213 | Tragic 12.0% |
| Immigrants | Somalia | 6.8 /100 | #214 | Tragic 12.0% |
| Immigrants | Canada | 6.1 /100 | #215 | Tragic 12.1% |
| Panamanians | 5.4 /100 | #216 | Tragic 12.1% |
| Immigrants | North America | 5.3 /100 | #217 | Tragic 12.1% |
| Immigrants | Jamaica | 5.0 /100 | #218 | Tragic 12.1% |
| Croatians | 4.9 /100 | #219 | Tragic 12.1% |
| Immigrants | Bahamas | 4.7 /100 | #220 | Tragic 12.1% |
| Northern Europeans | 4.2 /100 | #221 | Tragic 12.1% |
| Spanish American Indians | 4.1 /100 | #222 | Tragic 12.1% |
Demographics Similar to Immigrants from Cuba by Disability
In terms of disability, the demographic groups most similar to Immigrants from Cuba are Immigrants from Barbados (11.6%, a difference of 0.070%), Guatemalan (11.6%, a difference of 0.11%), Armenian (11.6%, a difference of 0.15%), Immigrants from Haiti (11.7%, a difference of 0.17%), and Immigrants from Trinidad and Tobago (11.7%, a difference of 0.19%).
| Demographics | Rating | Rank | Disability |
| Immigrants | Guatemala | 71.1 /100 | #154 | Good 11.6% |
| Immigrants | Netherlands | 69.8 /100 | #155 | Good 11.6% |
| Immigrants | Fiji | 69.5 /100 | #156 | Good 11.6% |
| Immigrants | Middle Africa | 69.5 /100 | #157 | Good 11.6% |
| Armenians | 65.9 /100 | #158 | Good 11.6% |
| Guatemalans | 65.1 /100 | #159 | Good 11.6% |
| Immigrants | Barbados | 64.2 /100 | #160 | Good 11.6% |
| Immigrants | Cuba | 62.8 /100 | #161 | Good 11.6% |
| Immigrants | Haiti | 59.2 /100 | #162 | Average 11.7% |
| Immigrants | Trinidad and Tobago | 58.9 /100 | #163 | Average 11.7% |
| Syrians | 58.5 /100 | #164 | Average 11.7% |
| Cubans | 56.7 /100 | #165 | Average 11.7% |
| Pakistanis | 54.7 /100 | #166 | Average 11.7% |
| Estonians | 54.4 /100 | #167 | Average 11.7% |
| Immigrants | Latin America | 54.1 /100 | #168 | Average 11.7% |