Soviet Union vs Immigrants from North America Disability Age 5 to 17
COMPARE
Soviet Union
Immigrants from North America
Disability Age 5 to 17
Disability Age 5 to 17 Comparison
Soviet Union
Immigrants from North America
5.0%
DISABILITY AGE 5 TO 17
100.0/ 100
METRIC RATING
32nd/ 347
METRIC RANK
5.7%
DISABILITY AGE 5 TO 17
23.1/ 100
METRIC RATING
197th/ 347
METRIC RANK
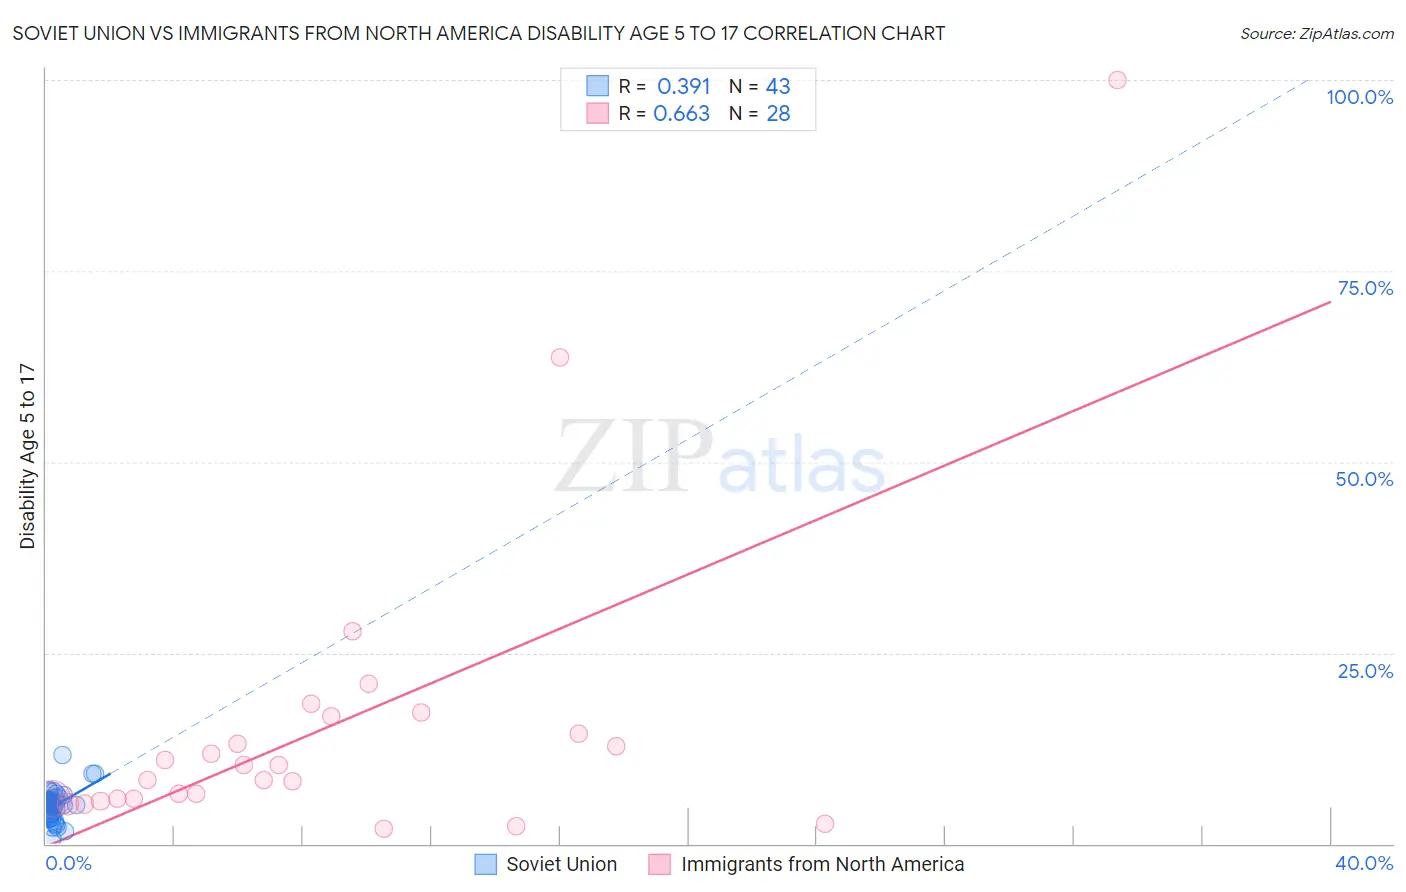
Soviet Union vs Immigrants from North America Disability Age 5 to 17 Correlation Chart
The statistical analysis conducted on geographies consisting of 43,434,016 people shows a mild positive correlation between the proportion of Soviet Union and percentage of population with a disability between the ages 5 and 17 in the United States with a correlation coefficient (R) of 0.391 and weighted average of 5.0%. Similarly, the statistical analysis conducted on geographies consisting of 456,706,371 people shows a significant positive correlation between the proportion of Immigrants from North America and percentage of population with a disability between the ages 5 and 17 in the United States with a correlation coefficient (R) of 0.663 and weighted average of 5.7%, a difference of 14.3%.
Disability Age 5 to 17 Correlation Summary
| Measurement | Soviet Union | Immigrants from North America |
| Minimum | 0.64% | 1.9% |
| Maximum | 11.6% | 100.0% |
| Range | 11.0% | 98.1% |
| Mean | 5.0% | 15.2% |
| Median | 5.2% | 9.3% |
| Interquartile 25% (IQ1) | 3.6% | 5.9% |
| Interquartile 75% (IQ3) | 5.7% | 15.6% |
| Interquartile Range (IQR) | 2.1% | 9.7% |
| Standard Deviation (Sample) | 2.0% | 20.3% |
| Standard Deviation (Population) | 2.0% | 20.0% |
Similar Demographics by Disability Age 5 to 17
Demographics Similar to Soviet Union by Disability Age 5 to 17
In terms of disability age 5 to 17, the demographic groups most similar to Soviet Union are Immigrants from Pakistan (5.0%, a difference of 0.040%), Immigrants from Malaysia (5.0%, a difference of 0.28%), Immigrants from Indonesia (5.0%, a difference of 0.32%), Israeli (5.0%, a difference of 0.44%), and Immigrants from Serbia (4.9%, a difference of 0.51%).
| Demographics | Rating | Rank | Disability Age 5 to 17 |
| Immigrants | Asia | 100.0 /100 | #25 | Exceptional 4.8% |
| Bhutanese | 100.0 /100 | #26 | Exceptional 4.9% |
| Taiwanese | 100.0 /100 | #27 | Exceptional 4.9% |
| Immigrants | Japan | 100.0 /100 | #28 | Exceptional 4.9% |
| Immigrants | Serbia | 100.0 /100 | #29 | Exceptional 4.9% |
| Immigrants | Malaysia | 100.0 /100 | #30 | Exceptional 5.0% |
| Immigrants | Pakistan | 100.0 /100 | #31 | Exceptional 5.0% |
| Soviet Union | 100.0 /100 | #32 | Exceptional 5.0% |
| Immigrants | Indonesia | 100.0 /100 | #33 | Exceptional 5.0% |
| Israelis | 100.0 /100 | #34 | Exceptional 5.0% |
| Bolivians | 100.0 /100 | #35 | Exceptional 5.0% |
| Immigrants | Egypt | 100.0 /100 | #36 | Exceptional 5.0% |
| Immigrants | Belarus | 100.0 /100 | #37 | Exceptional 5.0% |
| Immigrants | Philippines | 100.0 /100 | #38 | Exceptional 5.0% |
| Immigrants | Argentina | 100.0 /100 | #39 | Exceptional 5.0% |
Demographics Similar to Immigrants from North America by Disability Age 5 to 17
In terms of disability age 5 to 17, the demographic groups most similar to Immigrants from North America are Inupiat (5.7%, a difference of 0.010%), Immigrants from Nigeria (5.7%, a difference of 0.020%), Croatian (5.7%, a difference of 0.030%), Norwegian (5.7%, a difference of 0.16%), and Immigrants from Canada (5.7%, a difference of 0.19%).
| Demographics | Rating | Rank | Disability Age 5 to 17 |
| Immigrants | Eastern Africa | 27.3 /100 | #190 | Fair 5.7% |
| Danes | 26.5 /100 | #191 | Fair 5.7% |
| Immigrants | Bosnia and Herzegovina | 26.3 /100 | #192 | Fair 5.7% |
| Immigrants | Canada | 26.1 /100 | #193 | Fair 5.7% |
| Croatians | 23.6 /100 | #194 | Fair 5.7% |
| Immigrants | Nigeria | 23.4 /100 | #195 | Fair 5.7% |
| Inupiat | 23.3 /100 | #196 | Fair 5.7% |
| Immigrants | North America | 23.1 /100 | #197 | Fair 5.7% |
| Norwegians | 20.9 /100 | #198 | Fair 5.7% |
| Northern Europeans | 15.2 /100 | #199 | Poor 5.7% |
| Icelanders | 14.6 /100 | #200 | Poor 5.7% |
| Basques | 13.7 /100 | #201 | Poor 5.7% |
| Austrians | 13.2 /100 | #202 | Poor 5.7% |
| Spanish American Indians | 12.8 /100 | #203 | Poor 5.7% |
| Paiute | 11.2 /100 | #204 | Poor 5.7% |